Fig. 2.
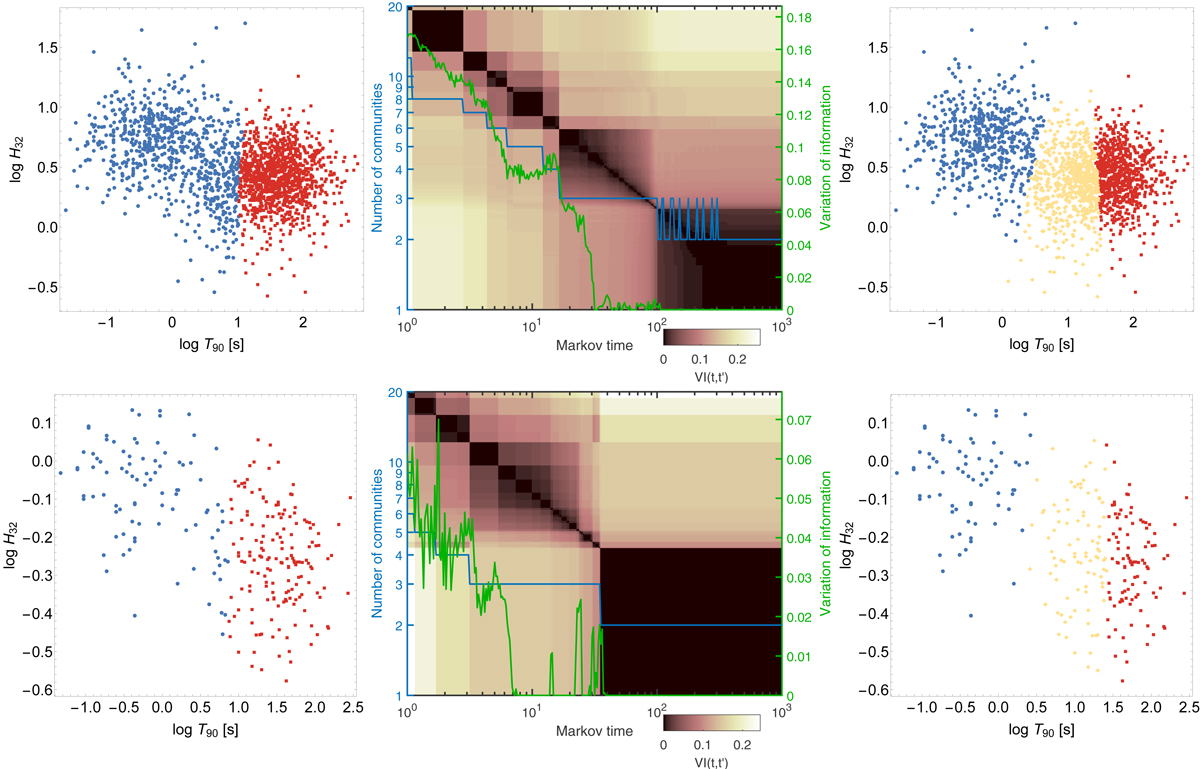
Download original image
BATSE (upper row) and Suzaku (bottom row) GRBs clustered with the CkNN algorithm. Left and right columns: partitioning into two and three groups, respectively; different colours (symbols – circles, squares, and diamonds) symbolise communities. The middle column shows the evolution of the number of communities and VI with Markov time t. The matrix plot in the background displays the VI(t, t′) matrix. Large blocks with small values on the diagonal relate to the number of communities (depicted with the blue line) that is dependent on the Markov time t. The sizes of the matrix blocks indicate the persistence of the corresponding number of communities. The VI is depicted with the green line. Overall, a significant partition is characterised by a large block of small values of the VI(t, t′) matrix, and a low level of the VI.
Current usage metrics show cumulative count of Article Views (full-text article views including HTML views, PDF and ePub downloads, according to the available data) and Abstracts Views on Vision4Press platform.
Data correspond to usage on the plateform after 2015. The current usage metrics is available 48-96 hours after online publication and is updated daily on week days.
Initial download of the metrics may take a while.