Open Access
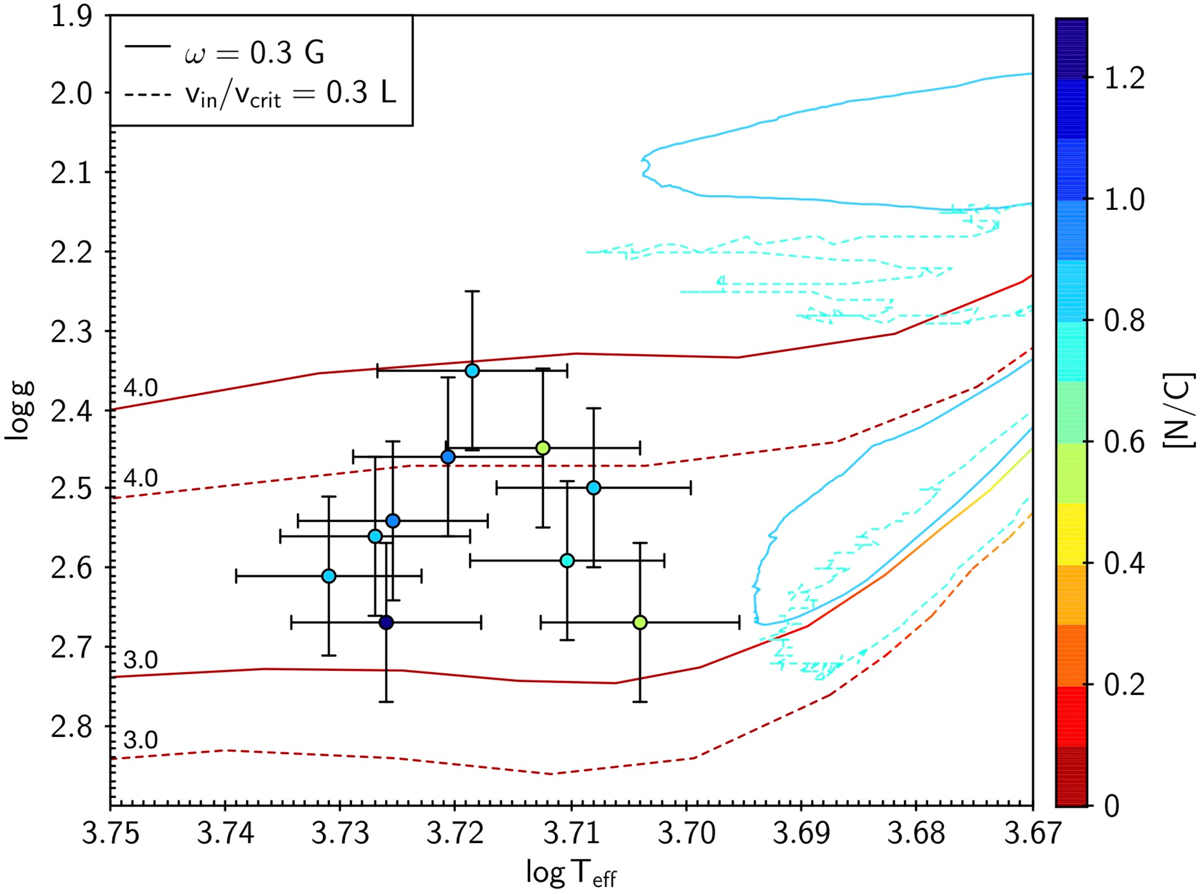
Fig. 12.
Download original image
Comparison between the Georgy et al. (2013) (solid lines) and Lagarde et al. (2012) (dashed lines) evolutionary tracks with rotation at Z = 0.014 for M = 3 M⊙, 4 M⊙. Stars in the sample with M = 3.5 M⊙, 4 M⊙ and −0.1 < [Fe/H]< 0.1 are shown with error bars. The colour index indicates the [N/C] abundance ratios.
Current usage metrics show cumulative count of Article Views (full-text article views including HTML views, PDF and ePub downloads, according to the available data) and Abstracts Views on Vision4Press platform.
Data correspond to usage on the plateform after 2015. The current usage metrics is available 48-96 hours after online publication and is updated daily on week days.
Initial download of the metrics may take a while.