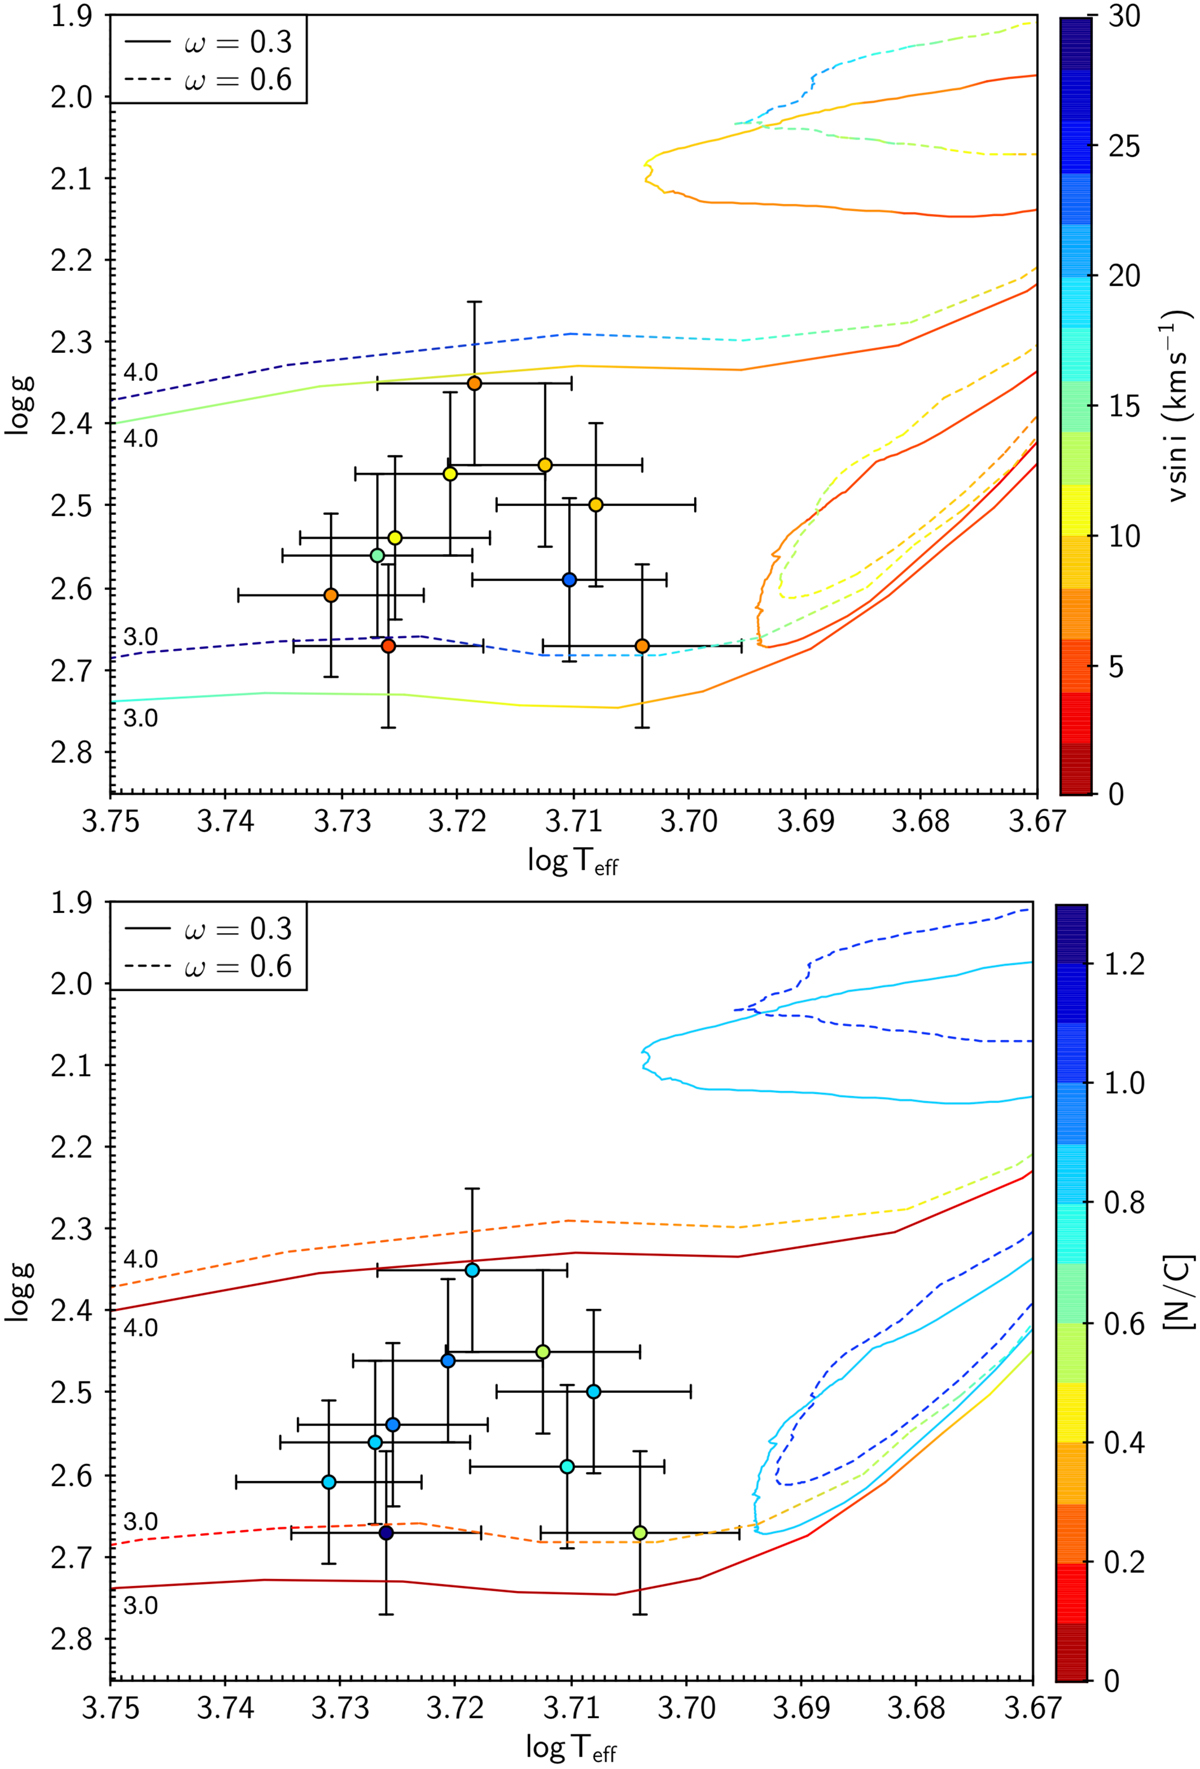
Fig. 11.
Download original image
Log Teff vs. log g diagram for the Georgy et al. (2013) evolutionary tracks with Z = 0.014, M = 3 M⊙, 4 M⊙, and ω = 0.3 (solid lines) and 0.6 (dashed lines). Stars in the sample with −0.1 < [Fe/H]< 0.1 and M = 3.5 M⊙, 4 M⊙ are shown with error bars. Upper panel: colour index indicates the equatorial velocity for evolutionary tracks and the observed v sin i for sample stars. Lower panel: colour index indicates the [N/C] abundance ratio.
Current usage metrics show cumulative count of Article Views (full-text article views including HTML views, PDF and ePub downloads, according to the available data) and Abstracts Views on Vision4Press platform.
Data correspond to usage on the plateform after 2015. The current usage metrics is available 48-96 hours after online publication and is updated daily on week days.
Initial download of the metrics may take a while.