| Issue |
A&A
Volume 656, December 2021
|
|
|---|---|---|
| Article Number | A79 | |
| Number of page(s) | 6 | |
| Section | Atomic, molecular, and nuclear data | |
| DOI | https://doi.org/10.1051/0004-6361/202141185 | |
| Published online | 03 December 2021 | |
Electron-impact ionization of Ar2+
Institute of Theoretical Physics and Astronomy Vilnius University,
Saulėtekio av. 3,
10257
Vilnius,
Lithuania
e-mail: This email address is being protected from spambots. You need JavaScript enabled to view it.
Received:
23
April
2021
Accepted:
20
September
2021
Abstract
We study electron-impact single-ionization cross-sections for all levels of the ground configuration of the Ar2+ ion using the distorted wave approximation. We investigate the influences of the direct ionization and excitation-autoionization processes on the total single-ionization cross sections. We used corrected energies for the levels of the Ar3+ ion so that the ionization threshold corresponds to the value recommended by National Institute of Standards and Technology (NIST). Radiative damping is taken into account for the ionization cross-sections of the indirect process. Excitations from the 3s and 3p subshells are investigated for the indirect process. We demonstrate that the excitations from the outermost 3p subshell of the ground configuration provide an important contribution to the single ionization cross-sections at low energies. Fairly good agreement with measurements is obtained for the ground level of the Ar2+ ion. We show that the direct ionization provides ~70% at peak of the total single-ionization cross-sections.
Key words: atomic processes / atomic data / plasmas
© ESO 2021
1 Introduction
Argon is one of the most abundant noble gases in the Universe. Lines of Ar were identified in the central stars of planetary nebulae and white dwarfs (Werner et al. 2007) and the solar corona (Del Zanna & Woods 2013; Del Zanna & DeLuca 2018). Furthermore, the emission spectra from the argon ions were studied in laboratory plasma (Draganić et al. 2003; Kühn et al. 2007; Burger et al. 2012; Carpenter et al. 2020).
Modeling the line formation in the spectra from plasma requires determination of the charge state distribution. The charge state distribution in the collisional plasma is defined by ionization and recombination processes. The electron-impact ionization cross-sections for the Ar2+ ion were measured using the crossed-beams technique (Muller et al. 1980; Mueller et al. 1985). However, experimental data from Mueller et al. (1985) showed consistently higher values than those of Muller et al. (1980) at higher collisional energies. Furthermore, an onset below the ground-state ionization energy demonstrated the presence of a metastable fraction in the ion beam (Mueller et al. 1985). A much lower contribution from the metastable levels was observed in the first experiment (Muller et al. 1980). However, the reason for the difference between experiments was not identified. A small enhancement at around 160 eV was observed in the empirical data provided by Danjo et al. (1984) for the Ar2+ ion. Good agreement with the results from Muller et al. (1980) was obtained at the lower energies of the incident electron (Danjo et al. 1984). On the other hand, the strong onset showing the contribution from the metastable states was observed by Danjo et al. (1984). Results from experiments were compared to predictions from the Lotz formula (Lotz 1967), which overestimated measurements at the higher energies and underestimated at the lower energies. Further studies from Matsumoto et al. (1990) also obtained the bump at ~160 eV. Furthermore, the cross-sections below the ionization threshold demonstrated the presence of metastable states. The later measurements by Man et al. (1993) showed excellent agreement with data from Diserens et al. (1988); the same apparatus was used in both experiments (Man et al. 1993; Diserens et al. 1988). The measurements of Mueller et al. (1985) provided greater values for the cross-sections compared to the results of Younger (1981) and Man et al. (1993) at the higher energies. The difference was attributed to the presence of the metastable fraction in the former case. A comparison of the experimental data obtained by Man et al. (1993) to the semi-empirical formulae of Lotz (1967) and Burgess & Chidichimo (1983) and parametrized distorted wave (DW) formula (Younger 1981) was provided. The Lotz formulae with one and three parameters were used in their study (Man et al. 1993). All peaks in theoretical curves shift to the high-energy side compared to the peak from the measurements. Later, the configuration average DW (CADW) method was applied to calculate the electron-impact ionization cross-sections for the Ar2+ ion (Loch et al. 2007). Good agreement with the measurements of Diserens et al. (1988) and Man et al. (1993) was demonstrated at the high energies. However, the empirical cross-sections were underestimated below and around the peak energy. The CADW calculations for the excitation-autoionization (EA) process contributed ~10% to the total cross-sections (Loch et al. 2007).
The aim of the current work is to study electron-impact single ionization for all levels of the ground configuration of the Ar2+ ion. We analyzed direct and indirect ionization processes. We used the corrected ionization threshold while studying the direct and indirectprocesses of the electron-impact ionization so that it corresponds to the recommended value from National Institute of Standards and Technology (NIST). The radiative damping of the EA cross-sections is included in the study.
The rest of the paper is organized as follows. Section 2 presents a brief outline of the theoretical approach. In Sect. 3, the obtained results are discussed. Finally, we end with the conclusions from the present investigation.
2 Theoretical methods
We used the Flexible Atomic Code (FAC; Gu 2008), which employs the Dirac-Fock-Slater (DFS) method, to calculate energy levels, radiative and Auger transition probabilities, electron-impact excitation, and ionization cross-sections. We investigate the cross-sections using the DW approximation, applying the single-configuration approximation. We used the local central potentials for the ground configurations to generate the necessary bound and continuum wavefunctions for each ion. We investigated direct and indirect processes to obtain the electron-impact single-ionization cross-sections from level i of the Ar2+ ion to level j of Ar3+:
 (1)
(1)
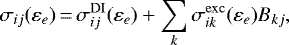
where  is the cross-section for the direct ionization (DI) at electron energy εe,
  is the electron-impact excitation cross-section, and the branching ratio is defined by the expression:
 (2)
(2)
 and
and  are Auger and radiative transition probabilities, respectively. The second term in the numerator represents the decay to the final level j through the intermediate levels n reached by a radiative transition from the initial excited level k. This higher-order term is not included in the current calculations because its full treatment would drastically increase the computational effort needed. The total single-ionization cross-sections are obtained by summing over all final levels j in Eq. (1). The inclusion of the branching ratios (Eq. (2)) in the cross-section calculations automatically takes care of radiative damping for the EA processes.
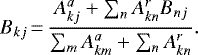
For theground configuration, DI includes ionization of the 3s and 3p subshells:
 (3)
(3)
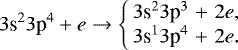
The ionization from the 2p subshell leads to double ionization of the Ar2+ ion. We investigated the EA channels for the following excitations from the ground configuration:
 (4)
(4)
where n ≤ 25 and l ≤ 4. Therefore, 371 excited configurations were produced for which we investigated radiative and Auger decay processes.
The resonant excitation double autoionization (REDA) process is not considered in this study. The contribution from the REDA process is often much smaller compared to DI and EA.
It was demonstrated that direct double ionization by electron impact can be represented as sequential processes of the single ionization and excitation (Jonauskas et al. 2014; Pindzola & Loch 2016; Konceviciūtė et al. 2018, 2019; Pindzola & Loch 2018). This means that the calculated single-ionization cross-sections have to be corrected by cross-sections transferred to the direct double ionization (Pakalka et al. 2018). However, the direct double-ionization cross sections are often lower by an order of magnitude than the single-ionization cross-sections, and are therefore not investigated here.
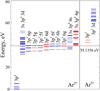 |
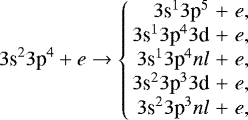
Fig. 1 Energy levels of the Ar2+ and Ar3+ ions. The single ionization threshold is presented as a horizontal line with the corresponding value. |
Energy levels (in eV) for the Ar2+ 3p4 ground configuration.
3 Results
Energy levels of configurations for the Ar2+ and Ar3+ ions are presented in Fig. 1. The ionization threshold amounts to 39.1 eV while a value of 40.7 eV is provided by NIST (Kramida et al. 2021). Therefore, the theoretical value is lower than the NIST value by ~1.6 eV (4%). Similar tendencies for the DFS ionization thresholds compared to the NIST data were obtained for other ions (Kwon & Savin 2012; Jonauskas et al. 2015, 2019; Jonauskas 2018; Kynienė et al. 2015; Konceviciūtė et al. 2018; Jin et al. 2020).
Energy levels of the ground configuration of the Ar2+ ion are compared to the NIST data in Table 1. It can be seen that splitting of the theoretical energy levels amounts to 5.0 eV while the NIST value is 4.1 eV. The difference can be explained by the correlation effects which are not considered in the current calculations.
It can be seen that there are many configurations with the energy levels that straddle the ionization threshold (Fig. 1). Some of these configurations correspond to promotion of an electron from the 3p subshell of the Ar2+ 3s2 3p4 configuration. Previous studies of the single ionization in other ions demonstrated the importance of excitations from the outermost subshell for indirect process (Kwon & Savin 2012). The energy levels of the 3s 3p4 3d and 3s 3p4 4s configurations straddle the ionization threshold while the 3s 3p44p configuration has energy levels above the ground level of the Ar3+ ion.
Theoretical single-ionization cross-sections for the Ar2+ ion are compared to the experimental data in Fig. 2. The cross-sections for other two levels, 3P1 and 3P0, are in close agreement with the values from 3P2 and are therefore not presented. The cross-sections of the direct process are evaluated in the potential of the ionized ion. Experimental data obtained by Diserens et al. (1988) and Man et al. (1993) are only presented in Fig. 2. These experimental data showed the lowest contribution from the metastable fraction in the ion beam. Measurements from Muller et al. (1980), Danjo et al. (1984), Mueller et al. (1985), and Matsumoto et al. (1990) demonstrated onsets below the ionization threshold. In addition, the CADW calculations (Loch et al. 2007) are presented for comparison in Fig. 2. The DW cross-sections for the ground level are in good agreement with the experimental results at low energies (Diserens et al. 1988; Man et al. 1993). However, the calculations are below the measurements at the high energies. The theoretical cross-sections are above the experimental values for the two highest levels of the ground configuration from the ionization threshold up to 200–300 eV, which is well beyond the peak region. On the other hand, good agreement with the measurements for these two levels is obtained at the higher energies. It should be noted that the CADW cross-sections (Loch et al. 2007) underestimate the measurements at the low electron energies. Excitations from the 2p subshell are investigated in the CADW calculations of these latter authors, but it is not clear whether the EA channels corresponding to the excitations from the 3s and 3p subshells are included in their study. On the other hand, decays of the excited Ar2+ 2p 53s 23p4 nl (n ≥ 4, l < n) configurations lead to states of the Ar4+ ion. The total excitation cross-sections from the 2p subshell amount to ~1 Mb at the peakenergy of 280 eV in our study. Therefore, the excitations from the 2p subshell are not investigated in this work.
The scaled DW cross-sections have previously been used to explain experimental data for neutral atoms and near neutral ions (Jonauskas 2018, 2020; Kynienė et al. 2019). Unfortunately, calculations for levels of the ground configuration of the Ar2+ ion show that peaks of the scaled DW cross-sections shift to higher energies (~40 eV higher) than the peaks observed in measurements (Diserens et al. 1988; Man et al. 1993).
Theoretical data for the cross-sections obtained in the potential of the ionizing ion are shown for the levels 3P2, 1D2, and 1S0 of the ground configuration in Fig. 3. The data are compared to measurements provided by Diserens et al. (1988) and Man et al. (1993). The theoretical cross-sections for the ground level are in good agreement with the measurements for low and high impacting electron energies. However, the experimental data are overestimated in the energy region from ~50 to 300 eV. The theoretical cross-sections are above the measurements by up to 9%. The cross-sections calculated for the two highest levels (1D2 and 1S0) are above the experimental peak by ~34 and ~55%, respectively.This clearly demonstrates the importance of the level-to-level study of the ionization process in the Ar2+ ion.
Theoretical cross-sections obtained using corrected energies for the levels of the Ar3+ ion are presented in Fig. 4. The energy levels of Ar3+ are increased by 1.6 eV so that the ionization threshold corresponds to the NIST recommended value. The same corrections for the energy levels are used below. The cross-sections of the direct process are determined in the potential of the ionizing ion. Relatively good agreement with experimental data from Diserens et al. (1988) and Man et al. (1993) is obtained forthe ground level over the entire energy range of the incident electron, except for the range from ~100 to 230 eV, where the empirical values are slightly below the theoretical cross-sections. As mentioned above, it was previously suggested that the theoretical single-ionization cross-sections have to be diminished by subtracting the direct double-ionization cross-sections (Pakalka et al. 2018; Jonauskas 2019). In that case, the direct double ionization isconsidered as a sequential ionization when an additional electron is removed from the atomic system by the scattered or ejected electron. The double ionization threshold amounts to 97.44 eV starting from where the experimental data are overestimated by calculations. However, further studies of the double ionization in the Ar2+ ion are required to include corrections in the single-ionization cross-sections.
The contributions from direct and indirect processes to the single-ionization cross-sections for the ground level are compared in Fig. 5. The EA cross-sections dominate at lower energies. The EA contribution amounts to ~30% at the peak of the total cross-sections. It should be noted that the CADW calculations suggest that this contribution is ~10% for the EA part (Loch et al. 2007). The input from the DI 3p channel dominates as compared to the other channels in our study. The DI 3s and DI 3p channels contribute ~10 and ~60%, respectively,to the total single-ionization cross-sections at peak values. The excitations from the 3p subshell add ~5%. It can be seen that the DW DI cross-sections (Fig. 5) are ~16% lower than suggested by the CADW DI results (Fig. 2). Lower DW DI cross-sections than the CADW DI ones have previously been reported for other ions (Zhang & Kwon 2014; Kynienė et al. 2015, 2016). The reason for the differences is not clear.
Excitations from the 2p subshell are not investigated in this study because many produced configurations can reach states of the Ar4+ ion, therefore, leading to double ionization. It should be noted that the 2p → 3p excitations lead to the Ar2+ 2p 53p5 configuration which decays to the Ar3+ 3p5, Ar3+ 3s 3p4, and Ar3+ 3p2 configurations. All these configurations are below the ground level of the Ar4+ ion. However, the contribution from this EA channel is lower than 1%.
The DFS Maxwellian rate coefficients that we obtain for the direct and indirect processes are compared to the CADW calculations by Loch et al. (2007) in Fig. 6. A dominant contribution from the direct process is obtained in both the present study and that by Loch et al. (2007). The CADW rate coefficients for the direct process are ~20% higher compared to the present results. Higher values for the CADW DI rate coefficients compared to the DFS ones were also obtained previously for tungsten ions (Zhang & Kwon 2014; Kynienė et al. 2015). The reason for this difference is not clear. The EA channels add ~25% to the total rate coefficient at the peak value in our study. We find that the contribution of excitations from the 3p subshell is equal to ~4%. We also find that the total DFS rate coefficient is only ~2% above the CADW value at 4 × 10⁶ K. However, the presented rate coefficients are above the CADW data by ~60% at 6 × 10⁴ K, which corresponds to the peak abundance of Ar2+ (Loch et al. 2007).
The EA cross-sections for levels of the ground configuration are compared in Fig. 7. The EA cross-sections for the 1D2 and 1S0 levels are higher than the ground level by ~55 and ~105% for peak values, respectively. Furthermore, the cross-sections for the 1D2 and 1S0 levels appear at energies below the ionization threshold by 2.04 and 5.00 eV, respectively.
Convergence of the EA cross-sections has to be reached in calculations to provide reliable data. The contributions from the EA channels corresponding to excitations to shells with the principal quantum numbers n ≤8, n ≤25, and n ≤40 are shown in Fig. 8. The contribution of the excitations to the shells with 9 < n ≤ 25 produces ~20% of the total EA cross-sections. The input from the excitations to the shells with 25 < n ≤ 40 is lower than 1%. Studies of ionization for the tungsten ions revealed that the excitations to the high-nl shells play an important role in the EA process (Zhang & Kwon 2014; Jonauskas et al. 2015; Kynienė et al. 2015, 2016; Jin et al. 2020). On the other hand, all these ions have a ground configuration with an open 4f subshell. For other tungsten ions, the contribution of the high-nl excitations is less important (Jonauskas et al. 2019).
The strongest EA channels corresponding to excitations from the 3s subshell arepresented in Fig. 9. The excitations from the 3s subshell to the 3d one contribute ~36% to the EA cross-sections. As mentioned above, energy levels of the 3s 3p43d configuration straddle the ionization threshold (Fig. 1).
The strongest EA channels corresponding to excitations from the 3p subshell areshown in Fig. 10. It should be noted that excitations from the 3p subshell show very slow convergence for the cross-sections. The strongest EA channel corresponds to the 3p → 7d excitations. The configuration produced has energy levels above the ionization threshold. The contribution from this channel to the EA cross-sections from the 3p subshell is only ~9%. The EA channels corresponding to the excitations from the 3p subshell produce ~6 Mb at the peak of the cross-sections (Fig. 10) while the excitations from the 3s subshell lead to ~18 Mb (Fig. 9).
Excitations to shells with the orbital quantum number l = 2 dominate compared tothe other orbital quantum numbers (Fig. 11). The contributions of the EA channels corresponding to the excitations to the shells with l = 0 and l = 1 are ~60% lower as compared tothe l = 2 case. It canbe seen that the EA channel produced by the excitations to the f orbital contributes ~10% of the total EA cross-sections. In addition, the contribution of the excitations to the g orbital is negligible. On the other hand, the studies of tungsten ions with an open 4f subshell in the ground configuration showed that the dominant input was from the excitations to the shells with the g orbital (Jonauskas et al. 2015; Kynienė et al. 2015, 2016).
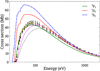 |
Fig. 2 Electron-impact single-ionization cross-sections for levels (3P2, 1D2, and 1S0) of the ground configuration of the Ar2+ ion. DI cross-sections are obtained in the potential of the ionized ion. Experiment: open circles with error bars – Diserens et al. (1988); open triangles with error bars – Man et al. (1993). Dotted line (magenta) – CADW total single-ionization cross-sections (Loch et al. 2007), dash-dash-dotted line (gray) – CADW DI cross-sections (Loch et al. 2007). |
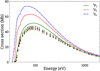 |
Fig. 3 Electron-impact single-ionization cross-sections for levels 3P2, 1D2, and 1S0 of the ground configuration of the Ar2+ ion. DI cross-sections are obtained in the potential of the ionizing ion. Experiment: open circles with error bars – Diserens et al. (1988); open triangles with error bars – Man et al. (1993). |
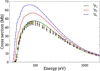 |
Fig. 4 Electron-impact single-ionization cross-sections for levels 3P2, 1D2, and 1S0 of the ground configuration of the Ar2+ ion. DI cross-sections are obtained in the potential of the ionizing ion. The single-ionization cross-sections are calculated using the corrected energy levels of the Ar3+ ion. Experiment: open circles with error bars – Diserens et al. (1988); open triangles with error bars – Man et al. (1993). See text for details. |
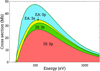 |
Fig. 5 Electron-impact single-ionization cross-sections for the ground level of the Ar2+ ion. The cross-sections are calculated using the corrected energy levels of the Ar3+ ion. See main text for details. |
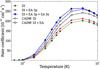 |
Fig. 6 Maxwellian rate coefficients for direct and indirect processes. |
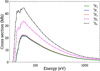 |
Fig. 7 EA cross-sections for the levels of the ground configuration of Ar2+. The cross-sections are calculated using the corrected energy levels of the Ar3+ ion. See main text for details. |
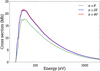 |
Fig. 8 EA cross-sections corresponding to excitations from the ground level up to shells with n = 8, n = 25, and n = 40. The cross-sections are calculated using the corrected energy levels of the Ar3+ ion. See main text for details. |
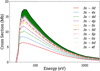 |
Fig. 9 Accumulated EA cross-sections for excitations from the 3s subshell.The cross-sections are calculated using the corrected energy levels of the Ar3+ ion. See text for details. |
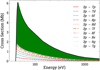 |
Fig. 10 Accumulated EA cross-sections for excitations from the 3p subshell.The cross-sections are calculated using the corrected energy levels of the Ar3+ ion. See main text for details. |
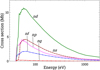 |
Fig. 11 EAcross-sections corresponding to excitations to various orbitals from the ground level of the Ar2+ ion. The cross-sections are calculated using the corrected energy levels of the Ar3+ ion. See main text for details. |
4 Conclusions
We studied electron-impact single-ionization cross-sections for all levels of the ground configuration of the Ar2+ ion. Our study includes direct and indirect processes of the single ionization. We used corrected energies for the levels of the Ar3+ ion so that the ionization threshold corresponds to the NIST value. Good agreement with measurements is obtained when corrected energies are used in the analysis of the single ionization by the electron impact.
Our study shows that the contribution from the DI process dominates for the ground level of the Ar2+ ion. The contribution from the EA process amounts to ~30% at the peak of the total ionization cross-sections. We also investigated excitations from the 3s and 3p subshells for the indirect process. The 3s → 3d excitations with the largest contribution to the EA cross-sections lead to a configuration that has energy levels that straddle the ionization threshold. These excitations provide ~36% of the total EA cross-sections. The contribution of the excitations from the 3p subshell amounts to ~4% at the peak of the total cross-sections. The excitations from the 3p subshell dominate at lower electron energies.
Finally, cross-sections for the direct, indirect, and total ionization by electron impact are presented as supplementary data. In addition, the Maxwellian rate coefficients are provided for all levels of the ground configuration of the Ar2+ ion. We present the contributions from different subshells in order that the data can be used not only for equilibrium plasmas but also for non-equilibrium modeling.
Acknowledgement
Part of the computations were performed on the High Performance Computing (HPC) cluster at the Institute of Theoretical Physics and Astronomy, Faculty of Physics, Vilnius University.
References
- Burger, M., Skočić, M., Gavrilov, M., Bukvić, S., & Djeniže, S. 2012, J. Quant. Spectr. Rad. Transf., 113, 1662 [NASA ADS] [CrossRef] [Google Scholar]
- Burgess, A., & Chidichimo, M. C. 1983, MNRAS, 203, 1269 [NASA ADS] [CrossRef] [Google Scholar]
- Carpenter, K. R., Mancini, R. C., Harding, E. C., et al. 2020, Phys. Rev. E, 102, 023209 [NASA ADS] [CrossRef] [Google Scholar]
- Danjo, A., Matsumoto, A., Ohtani, S., et al. 1984, J. Phys. Soc. Jpn., 53, 4091 [NASA ADS] [CrossRef] [Google Scholar]
- Del Zanna, G., & DeLuca, E. E. 2018, ApJ, 852, 52 [NASA ADS] [CrossRef] [Google Scholar]
- Del Zanna, G., & Woods, T. N. 2013, A&A, 555, A59 [NASA ADS] [CrossRef] [EDP Sciences] [Google Scholar]
- Diserens, M. J., Smith, A. C. H., & Harrison, M. F. A. 1988, J. Phys. B At. Mol. Opt. Phys., 21, 2129 [CrossRef] [Google Scholar]
- Draganić, I., Crespo López-Urrutia, J. R., DuBois, R., et al. 2003, Phys. Rev. Lett., 91, 183001 [CrossRef] [Google Scholar]
- Gu, M. F. 2008, Can. J. Phys., 86, 675 [NASA ADS] [CrossRef] [Google Scholar]
- Jin, F., Borovik, A., Ebinger, B., & Schippers, S. 2020, J. Phys. B At. Mol. Opt. Phys., 53, 075201 [NASA ADS] [CrossRef] [Google Scholar]
- Jonauskas, V. 2018, A&A, 620, A188 [NASA ADS] [CrossRef] [EDP Sciences] [Google Scholar]
- Jonauskas, V. 2019, J. Quant. Spectr. Rad. Transf., 239, 106659 [NASA ADS] [CrossRef] [Google Scholar]
- Jonauskas, V. 2020, At. Data Nucl. Data Tables, 135, 101363 [Google Scholar]
- Jonauskas, V., Prancikevičius, A., Masys, Š., & Kynienė, A. 2014, Phys. Rev. A, 89, 052714 [NASA ADS] [CrossRef] [Google Scholar]
- Jonauskas, V., Kynienė, A., Merkelis, G., et al. 2015, Phys. Rev. A, 91, 012715 [NASA ADS] [CrossRef] [Google Scholar]
- Jonauskas, V., Kynienė, A., Kučas, S., et al. 2019, Phys. Rev. A, 100, 062701 [NASA ADS] [CrossRef] [Google Scholar]
- Konceviciūtė, J., Kucas, S., Masys, Š., Kynienė, A., & Jonauskas, V. 2018, Phys. Rev. A, 97, 012705 [CrossRef] [Google Scholar]
- Koncevičiutė, J., Kučas, S., Kynienė, A., Masys, Š. & Jonauskas, V. 2019, J. Phys. B At. Mol. Opt. Phys., 52, 025203 [CrossRef] [Google Scholar]
- Kramida, A., Ralchenko, Yu., Reader, J., & NIST ASD Team. 2021, NIST Atomic Spectra Database (ver. 5.8) [Google Scholar]
- Kučas, S., Drabužinskis, P., Kynienė, A., Masys, Š., & Jonauskas, V. 2019, J. Phys. B At. Mol. Opt. Phys., 52, 225001 [CrossRef] [Google Scholar]
- Kühn, G., Könemann, F., & Kock, M. 2007, J. Quant. Spectr. Rad. Transf., 105, 102 [CrossRef] [Google Scholar]
- Kwon, D.-H., & Savin, D. W. 2012, Phys. Rev. A, 86, 022701 [NASA ADS] [CrossRef] [Google Scholar]
- Kynienė, A., Masys, Š., & Jonauskas, V. 2015, Phys. Rev. A, 91, 062707 [CrossRef] [Google Scholar]
- Kynienė, A., Pakalka, S., Masys, Š., & Jonauskas, V. 2016, J. Phys. B At. Mol. Opt. Phys., 49, 185001 [CrossRef] [Google Scholar]
- Kynienė, A., Kučas, S., Pakalka, S., Masys, Š., & Jonauskas, V. 2019, Phys. Rev. A, 100, 052705 [CrossRef] [Google Scholar]
- Loch, S. D., Abdel-Naby, S. A., Ballance, C. P., & Pindzola, M. S. 2007, Phys. Rev. A, 76, 022706 [NASA ADS] [CrossRef] [Google Scholar]
- Lotz, W. 1967, J. Opt. Soc. Am., 57, 873 [NASA ADS] [CrossRef] [Google Scholar]
- Man, K. F., Smith, A. C. H., & Harrison, M. F. A. 1993, J. Phys B At. Mol. Opt. Phys., 26, 1365 [NASA ADS] [CrossRef] [Google Scholar]
- Matsumoto, A., Danjo, A., Ohtani, S., et al. 1990, J. Phys. Soc. Jpn., 59, 902 [NASA ADS] [CrossRef] [Google Scholar]
- Mueller, D. W., Morgan, T. J., Dunn, G. H., Gregory, D. C., & Crandall, D. H. 1985, Phys. Rev. A, 31, 2905 [NASA ADS] [CrossRef] [Google Scholar]
- Muller, A., Salzborn, E., Frodl, R., et al. 1980, J. Phys. B At. Mol. Phys., 13, 1877 [NASA ADS] [CrossRef] [Google Scholar]
- Pakalka, S., Kučas, S., Masys, Š., et al. 2018, Phys. Rev. A, 97, 012708 [NASA ADS] [CrossRef] [Google Scholar]
- Pindzola, M. S., & Loch, S. D. 2016, J. Phys. B At. Mol. Opt. Phys., 49, 125202 [NASA ADS] [CrossRef] [Google Scholar]
- Pindzola, M. S., & Loch, S. D. 2018, J. Phys. B At. Mol. Opt. Phys., 51, 015202 [NASA ADS] [CrossRef] [Google Scholar]
- Werner, K., Rauch, T., & Kruk, J. W. 2007, A&A, 466, 317 [NASA ADS] [CrossRef] [EDP Sciences] [Google Scholar]
- Younger, S. M. 1981, Phys. Rev. A, 24, 1278 [NASA ADS] [CrossRef] [Google Scholar]
- Zhang, D.-H., & Kwon, D.-H. 2014, J. Phys. B At. Mol. Opt. Phys., 47, 075202 [NASA ADS] [CrossRef] [Google Scholar]
All Tables
All Figures
|
Fig. 1 Energy levels of the Ar2+ and Ar3+ ions. The single ionization threshold is presented as a horizontal line with the corresponding value. |
| In the text | |
|
Fig. 2 Electron-impact single-ionization cross-sections for levels (3P2, 1D2, and 1S0) of the ground configuration of the Ar2+ ion. DI cross-sections are obtained in the potential of the ionized ion. Experiment: open circles with error bars – Diserens et al. (1988); open triangles with error bars – Man et al. (1993). Dotted line (magenta) – CADW total single-ionization cross-sections (Loch et al. 2007), dash-dash-dotted line (gray) – CADW DI cross-sections (Loch et al. 2007). |
| In the text | |
|
Fig. 3 Electron-impact single-ionization cross-sections for levels 3P2, 1D2, and 1S0 of the ground configuration of the Ar2+ ion. DI cross-sections are obtained in the potential of the ionizing ion. Experiment: open circles with error bars – Diserens et al. (1988); open triangles with error bars – Man et al. (1993). |
| In the text | |
|
Fig. 4 Electron-impact single-ionization cross-sections for levels 3P2, 1D2, and 1S0 of the ground configuration of the Ar2+ ion. DI cross-sections are obtained in the potential of the ionizing ion. The single-ionization cross-sections are calculated using the corrected energy levels of the Ar3+ ion. Experiment: open circles with error bars – Diserens et al. (1988); open triangles with error bars – Man et al. (1993). See text for details. |
| In the text | |
|
Fig. 5 Electron-impact single-ionization cross-sections for the ground level of the Ar2+ ion. The cross-sections are calculated using the corrected energy levels of the Ar3+ ion. See main text for details. |
| In the text | |
|
Fig. 6 Maxwellian rate coefficients for direct and indirect processes. |
| In the text | |
|
Fig. 7 EA cross-sections for the levels of the ground configuration of Ar2+. The cross-sections are calculated using the corrected energy levels of the Ar3+ ion. See main text for details. |
| In the text | |
|
Fig. 8 EA cross-sections corresponding to excitations from the ground level up to shells with n = 8, n = 25, and n = 40. The cross-sections are calculated using the corrected energy levels of the Ar3+ ion. See main text for details. |
| In the text | |
|
Fig. 9 Accumulated EA cross-sections for excitations from the 3s subshell.The cross-sections are calculated using the corrected energy levels of the Ar3+ ion. See text for details. |
| In the text | |
|
Fig. 10 Accumulated EA cross-sections for excitations from the 3p subshell.The cross-sections are calculated using the corrected energy levels of the Ar3+ ion. See main text for details. |
| In the text | |
|
Fig. 11 EAcross-sections corresponding to excitations to various orbitals from the ground level of the Ar2+ ion. The cross-sections are calculated using the corrected energy levels of the Ar3+ ion. See main text for details. |
| In the text | |
Current usage metrics show cumulative count of Article Views (full-text article views including HTML views, PDF and ePub downloads, according to the available data) and Abstracts Views on Vision4Press platform.
Data correspond to usage on the plateform after 2015. The current usage metrics is available 48-96 hours after online publication and is updated daily on week days.
Initial download of the metrics may take a while.