Fig. 5.
Download original image
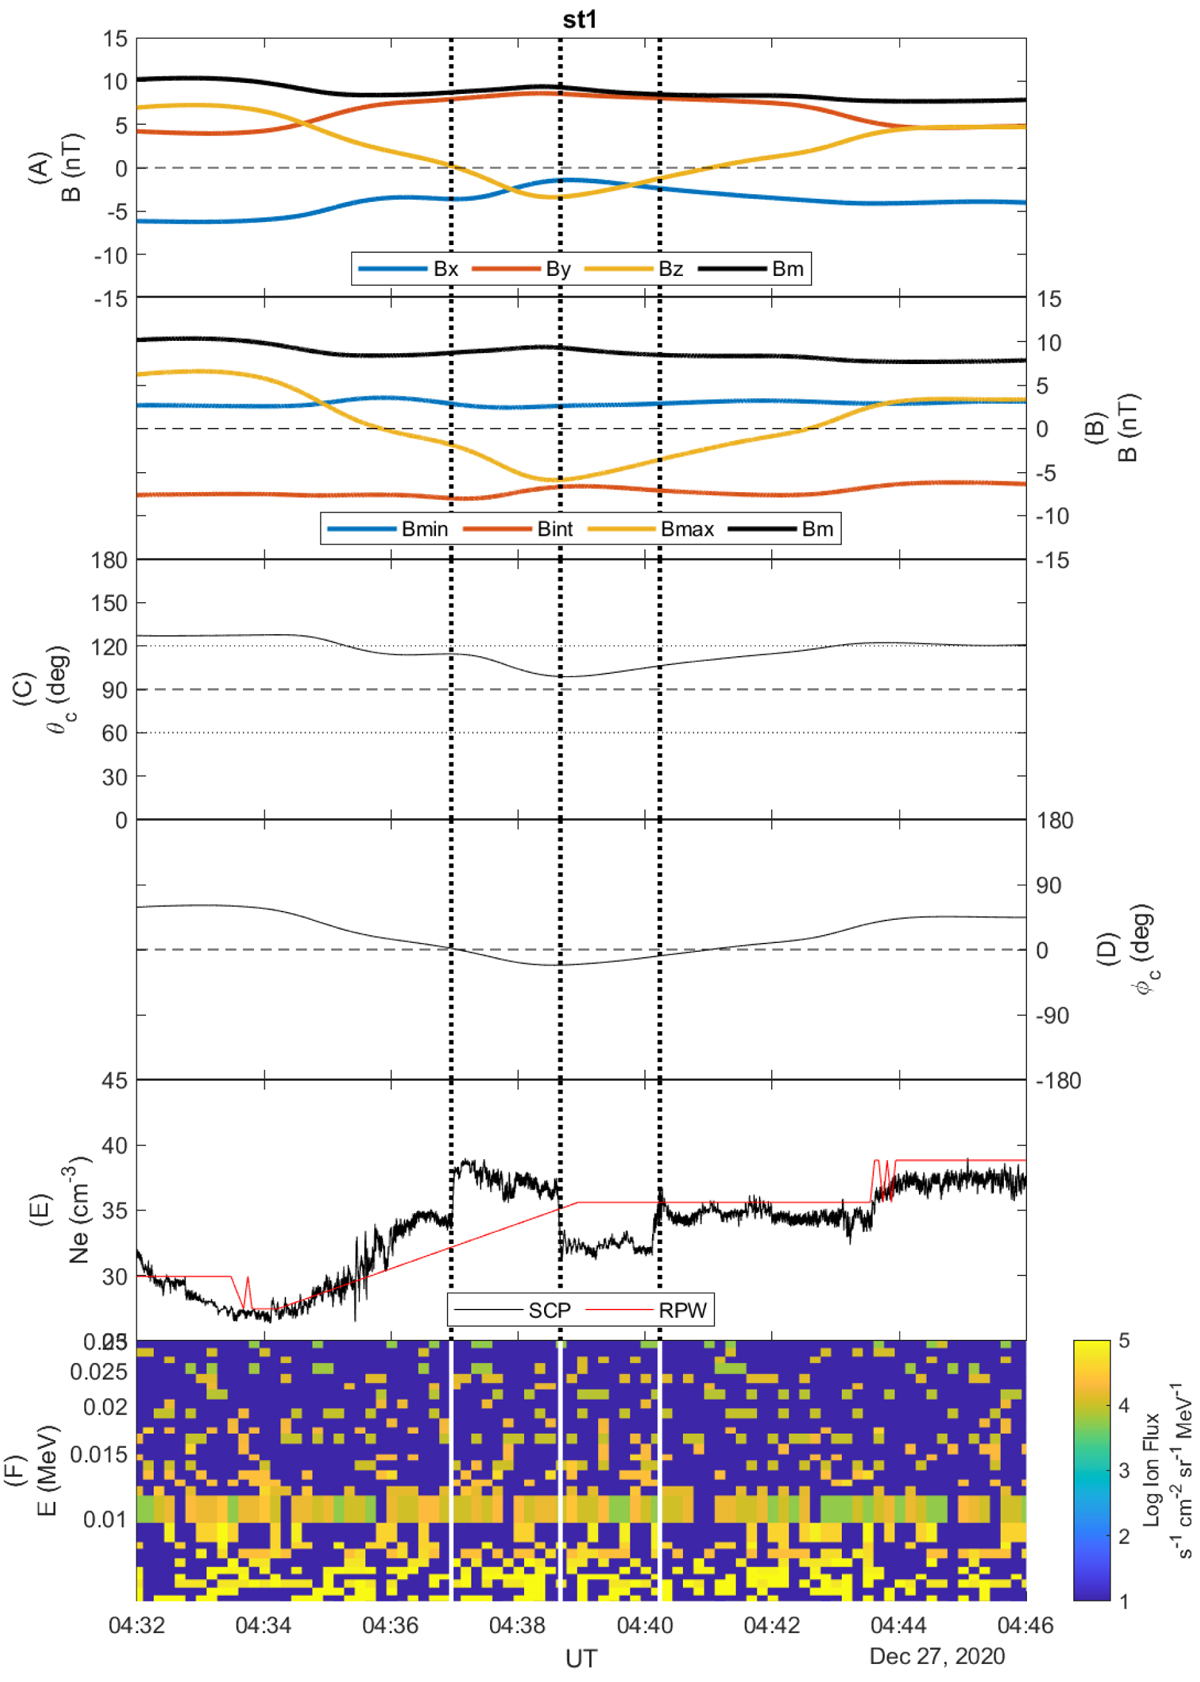
Zoom-in on the flux tube: st1. Shown: (A) Magnetic field data in VSO coordinates; (B) The magnetic field in MVA-coordinates; (C) The cone angle θc; (D) The clock angle ϕc; (E) The electron density determined from RPW (red) and SCP (black); (F) The time-energy spectrogram of the EPD-STEP instrument. The three dotted vertical lines show where Bz changes sign and has its minimum negative value. The horizontal line at 0.01 MeV in panel F is an instrumental artefact.
Current usage metrics show cumulative count of Article Views (full-text article views including HTML views, PDF and ePub downloads, according to the available data) and Abstracts Views on Vision4Press platform.
Data correspond to usage on the plateform after 2015. The current usage metrics is available 48-96 hours after online publication and is updated daily on week days.
Initial download of the metrics may take a while.