Fig. 4.
Download original image
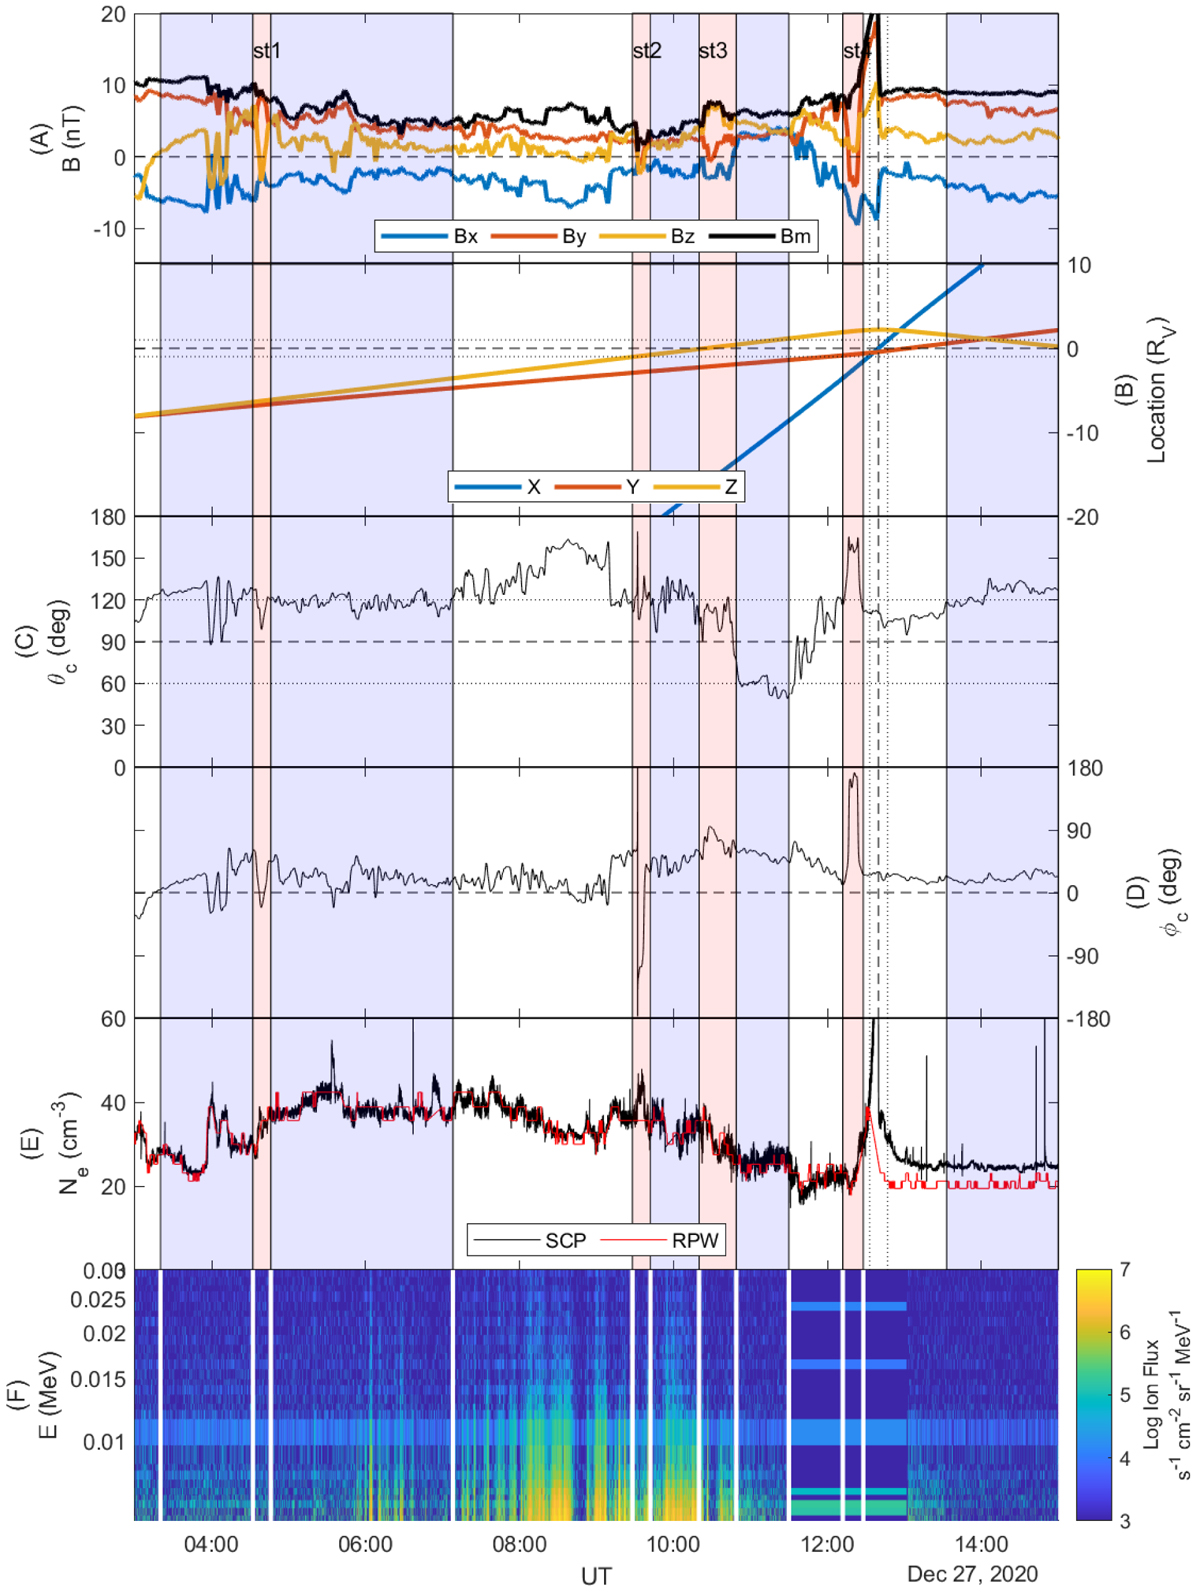
Combined instrument data for the ∼12 h flyby through the induced magnetotial and into the solar wind. (A) Low-pass filtered magnetic field data; (B) Location of the spacecraft in RV; (C) The cone angle θc; (D) The clock angle ϕc; (E) The electron density determined from RPW (red) and SCP (black); (F) The time-energy spectrogram of the EPD-STEP instrument. The blue-shaded intervals indicate where the field has the direction of the upstream solar wind. The red-shaded intervals indicate significant structures in the magnetic field. The two dotted lines in the cone angle panel C at θc = 60° /120° show the solar wind θc, SW ≈ 120°. The vertical black dashed and dotted lines show XVSO = 1 and ±1 RV, respectively.
Current usage metrics show cumulative count of Article Views (full-text article views including HTML views, PDF and ePub downloads, according to the available data) and Abstracts Views on Vision4Press platform.
Data correspond to usage on the plateform after 2015. The current usage metrics is available 48-96 hours after online publication and is updated daily on week days.
Initial download of the metrics may take a while.