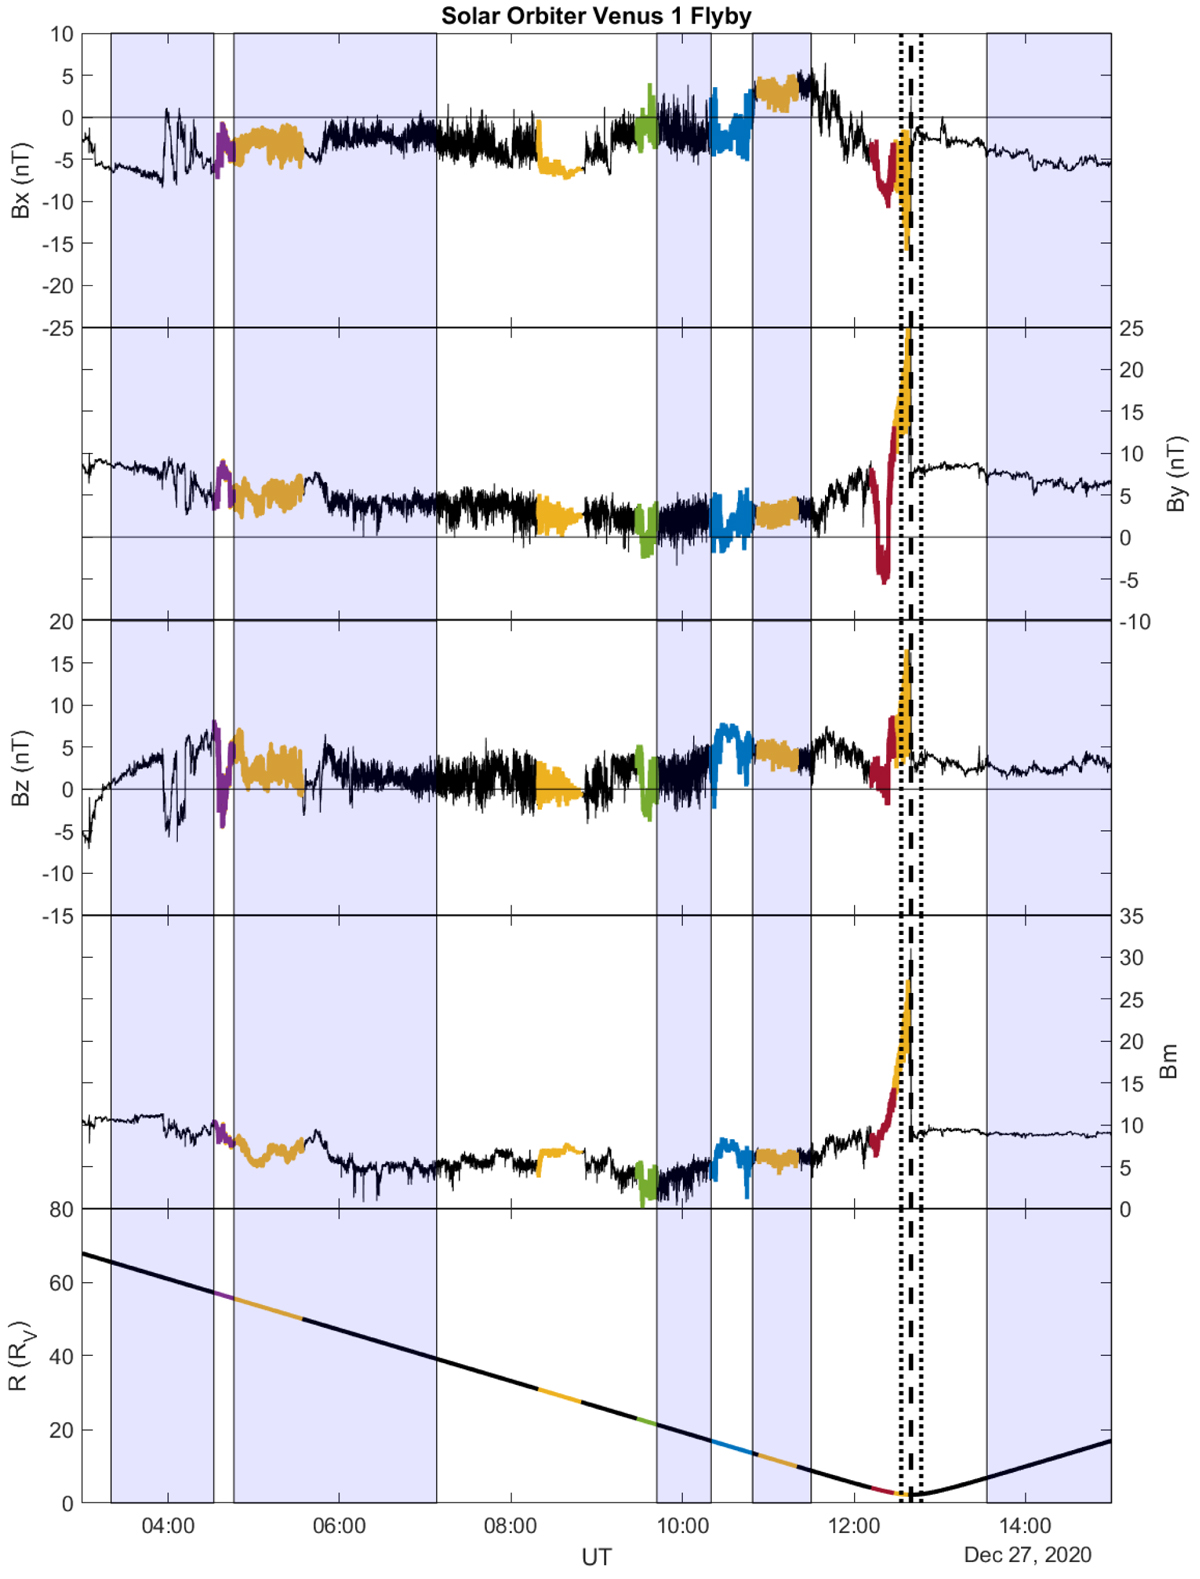
Fig. 2.
Download original image
Magnetometer data, all three components and magnitude and the radial distance from Venus in VSO coordinates. The dashed vertical line is the time of the bow shock crossing, the dotted vertical lines show the region ±1 RV. The blue shaded intervals indicate where the field has the direction of the upstream solar wind. The colouring of the traces is according to which activity is observed in the magnetic field, as in Fig. 1.
Current usage metrics show cumulative count of Article Views (full-text article views including HTML views, PDF and ePub downloads, according to the available data) and Abstracts Views on Vision4Press platform.
Data correspond to usage on the plateform after 2015. The current usage metrics is available 48-96 hours after online publication and is updated daily on week days.
Initial download of the metrics may take a while.