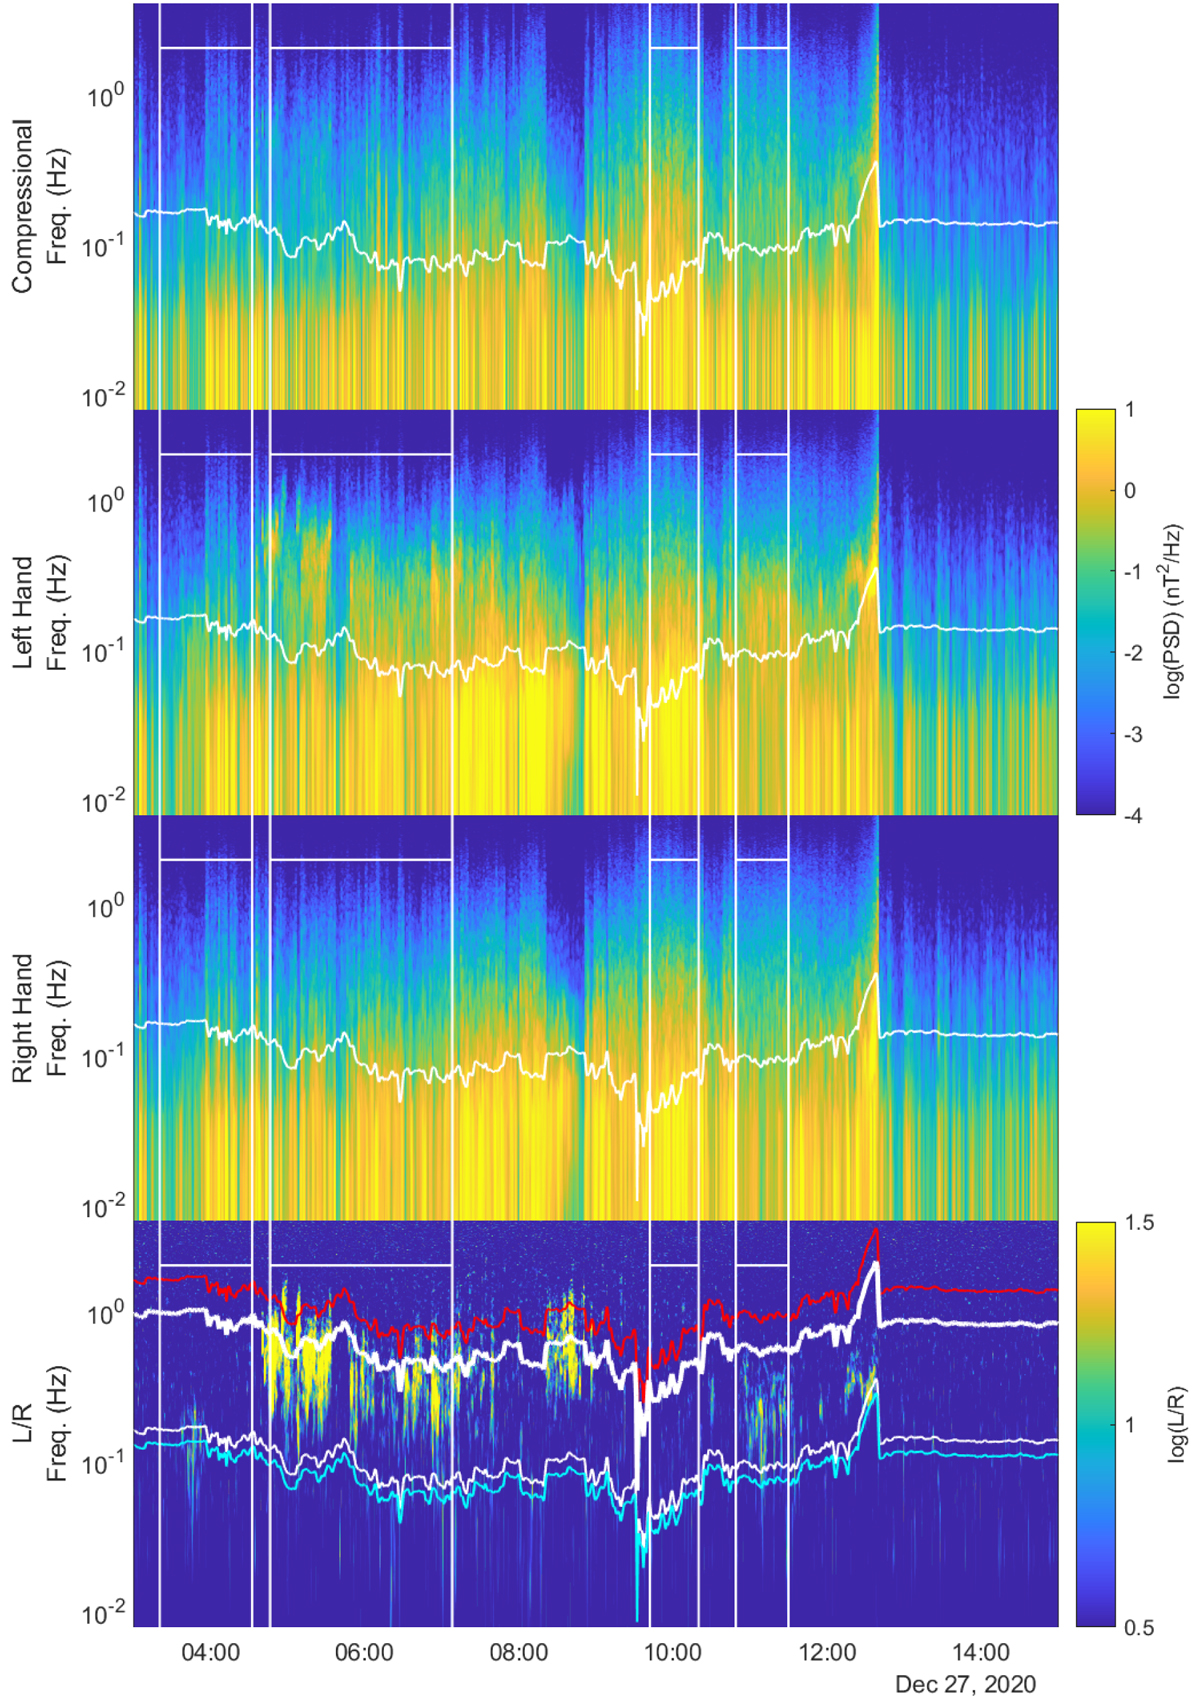
Fig. 10.
Download original image
Dynamical spectra of the compressional (C), left- (L), and right-hand (R) polarised field components during the entire flyby. The white vertical lines connected by horizontal lines are the regions where θc ≈ θc, SW. The bottom panel shows the ratio L/R. The thin white lines are the proton cyclotron frequency fcp. The thick red and white line in the bottom panel are ten and six times the proton cyclotron frequency, respectively (see text).
Current usage metrics show cumulative count of Article Views (full-text article views including HTML views, PDF and ePub downloads, according to the available data) and Abstracts Views on Vision4Press platform.
Data correspond to usage on the plateform after 2015. The current usage metrics is available 48-96 hours after online publication and is updated daily on week days.
Initial download of the metrics may take a while.