Fig. 6
Download original image
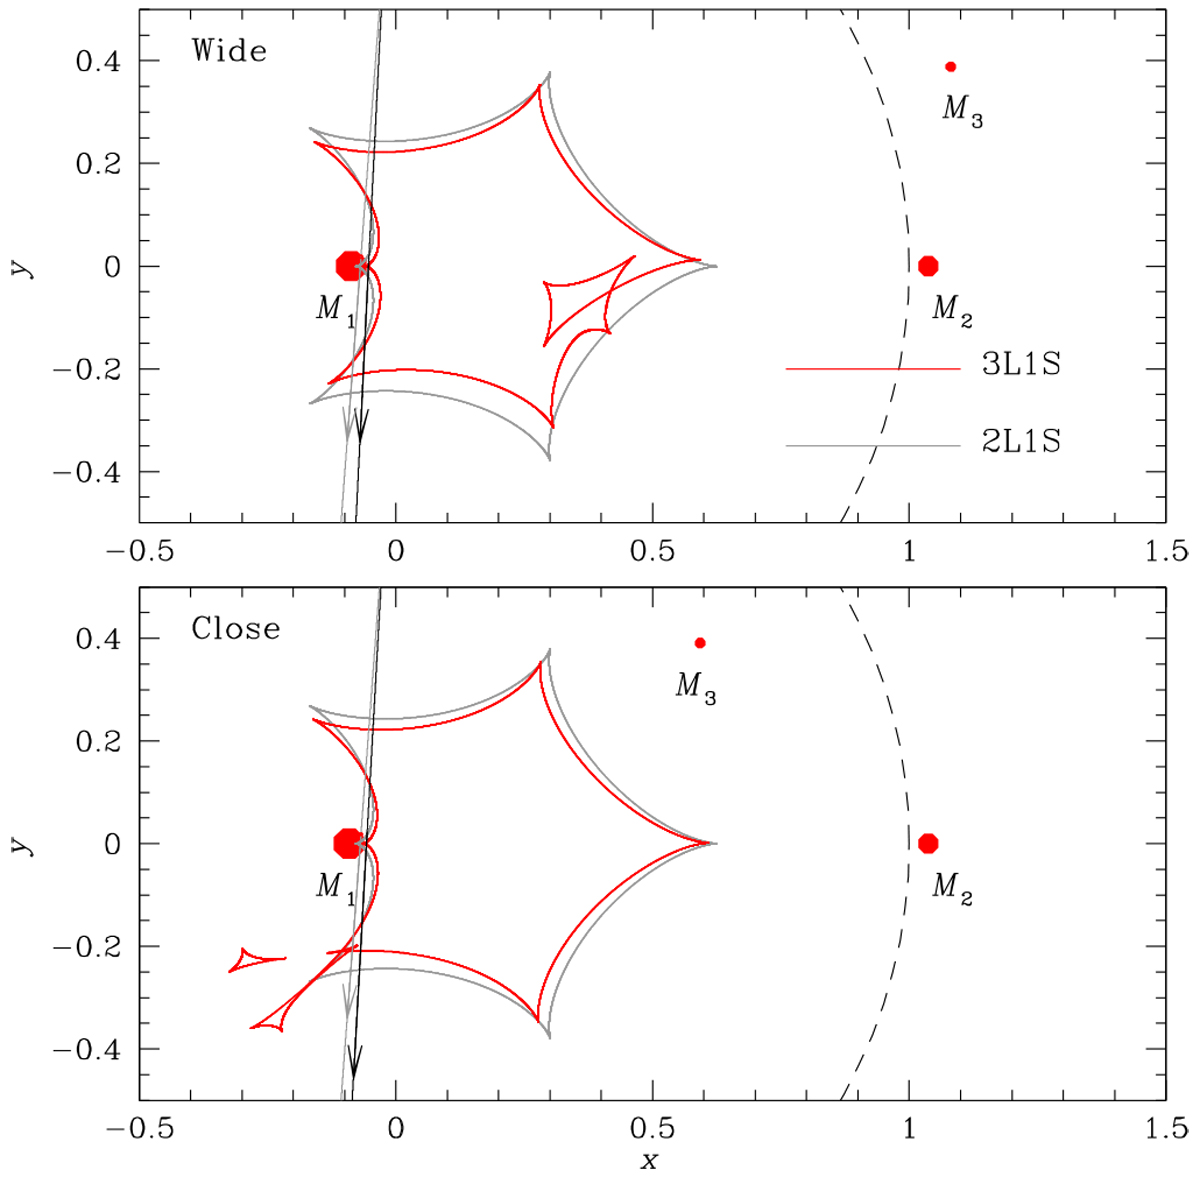
Lens system configurations according to the wide (upper panel) and close (lower panel) 3L1S solutions. In each panel, the nested concave curve represents the caustic, the line with an arrow is the source trajectory, and the three filled red dots marked by M1, M2, and M3 indicate the positions of the lens components. The caustic curve and the source trajectory according to the static 2L1S model are drawn in gray to show the caustic variation by the third body M3. Other notations are same as those in Fig. 3.
Current usage metrics show cumulative count of Article Views (full-text article views including HTML views, PDF and ePub downloads, according to the available data) and Abstracts Views on Vision4Press platform.
Data correspond to usage on the plateform after 2015. The current usage metrics is available 48-96 hours after online publication and is updated daily on week days.
Initial download of the metrics may take a while.