Fig. 4
Download original image
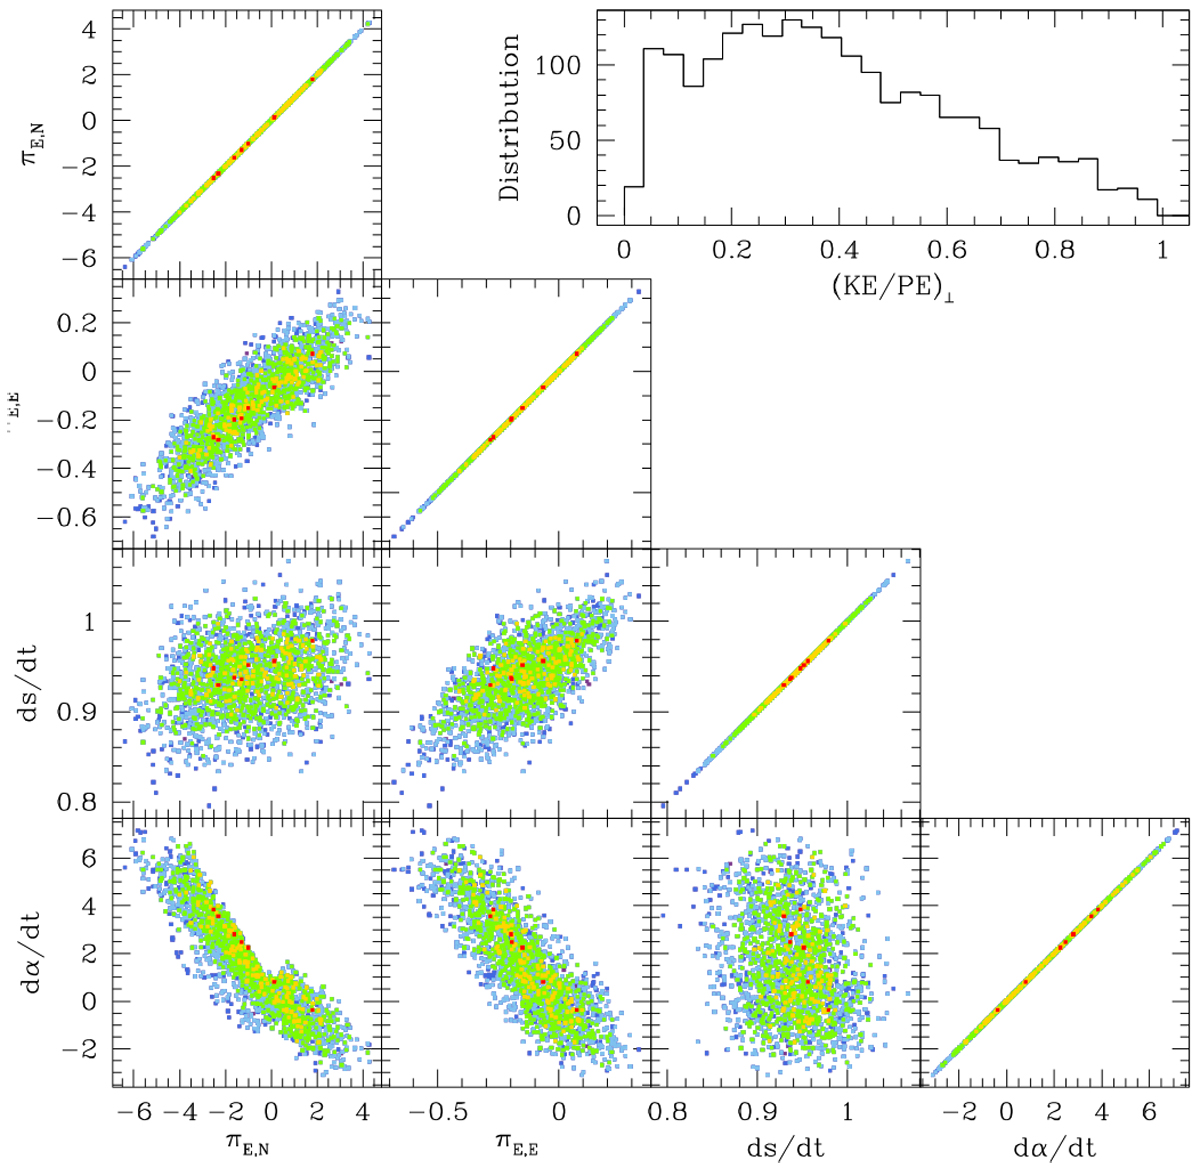
Δχ2 distribution of points in the MCMC chain of the 2L1S solution on the planes of higher-order parameters: πE,N, πE,E, d s∕d t, and d α∕dt. Points with different colors indicate those with Δχ2 ≤ 1σ (red), ≤2σ (yellow), ≤ 3σ (green), ≤ 4σ (cyan), and ≤ 5σ (blue). The upper right panel shows the distribution of the projected kinetic-to-potential energy ratio.
Current usage metrics show cumulative count of Article Views (full-text article views including HTML views, PDF and ePub downloads, according to the available data) and Abstracts Views on Vision4Press platform.
Data correspond to usage on the plateform after 2015. The current usage metrics is available 48-96 hours after online publication and is updated daily on week days.
Initial download of the metrics may take a while.