Fig. 3
Download original image
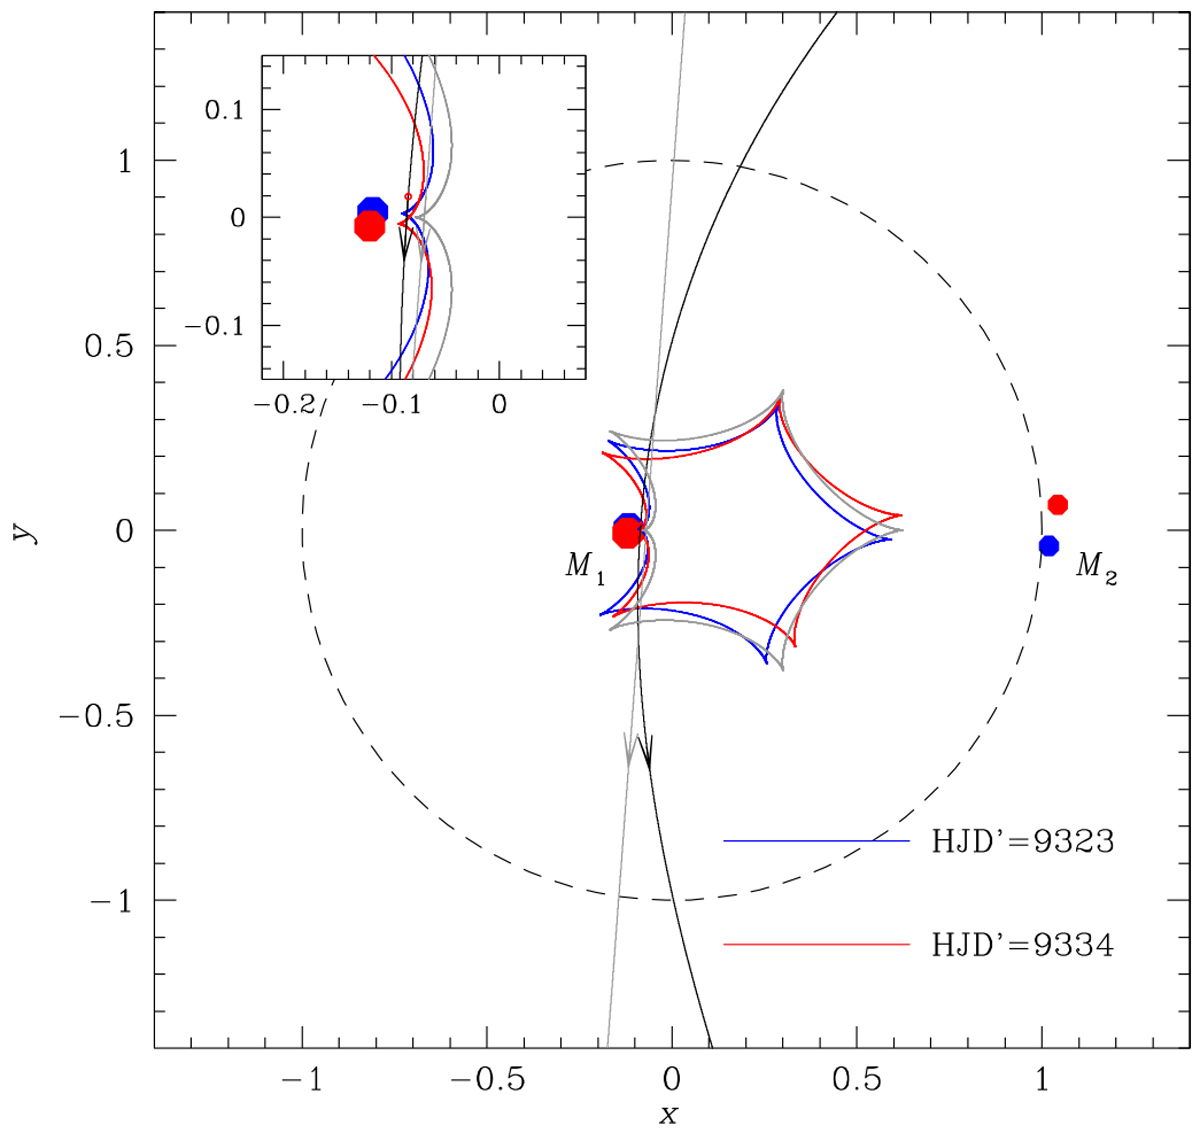
Lens system configuration according to the 2L1S model. The concave curve represents the caustic, the line with an arrow is the source trajectory, and the filled dots marked by M1 and M2 indicate the positions of the lens components. The caustic of the standard model are drawn in gray. For the higher-order model, in which the lens position and caustic vary in time because of the lens orbital motion, we mark the lens and caustic at two epochs of HJD′ = 9323 (marked in blue color) and 9334 (in red color). The source trajectories of the standard and higher-order models are drawn in gray and black. The inset shows the zoom-in view of the region around M1. The coordinates are centered at the photocenter and lengths are scaled to the angular Einstein radius corresponding to the total mass of the lens. The dashed unit circle centered at the origin represents the Einstein ring.
Current usage metrics show cumulative count of Article Views (full-text article views including HTML views, PDF and ePub downloads, according to the available data) and Abstracts Views on Vision4Press platform.
Data correspond to usage on the plateform after 2015. The current usage metrics is available 48-96 hours after online publication and is updated daily on week days.
Initial download of the metrics may take a while.