Fig. 2
Download original image
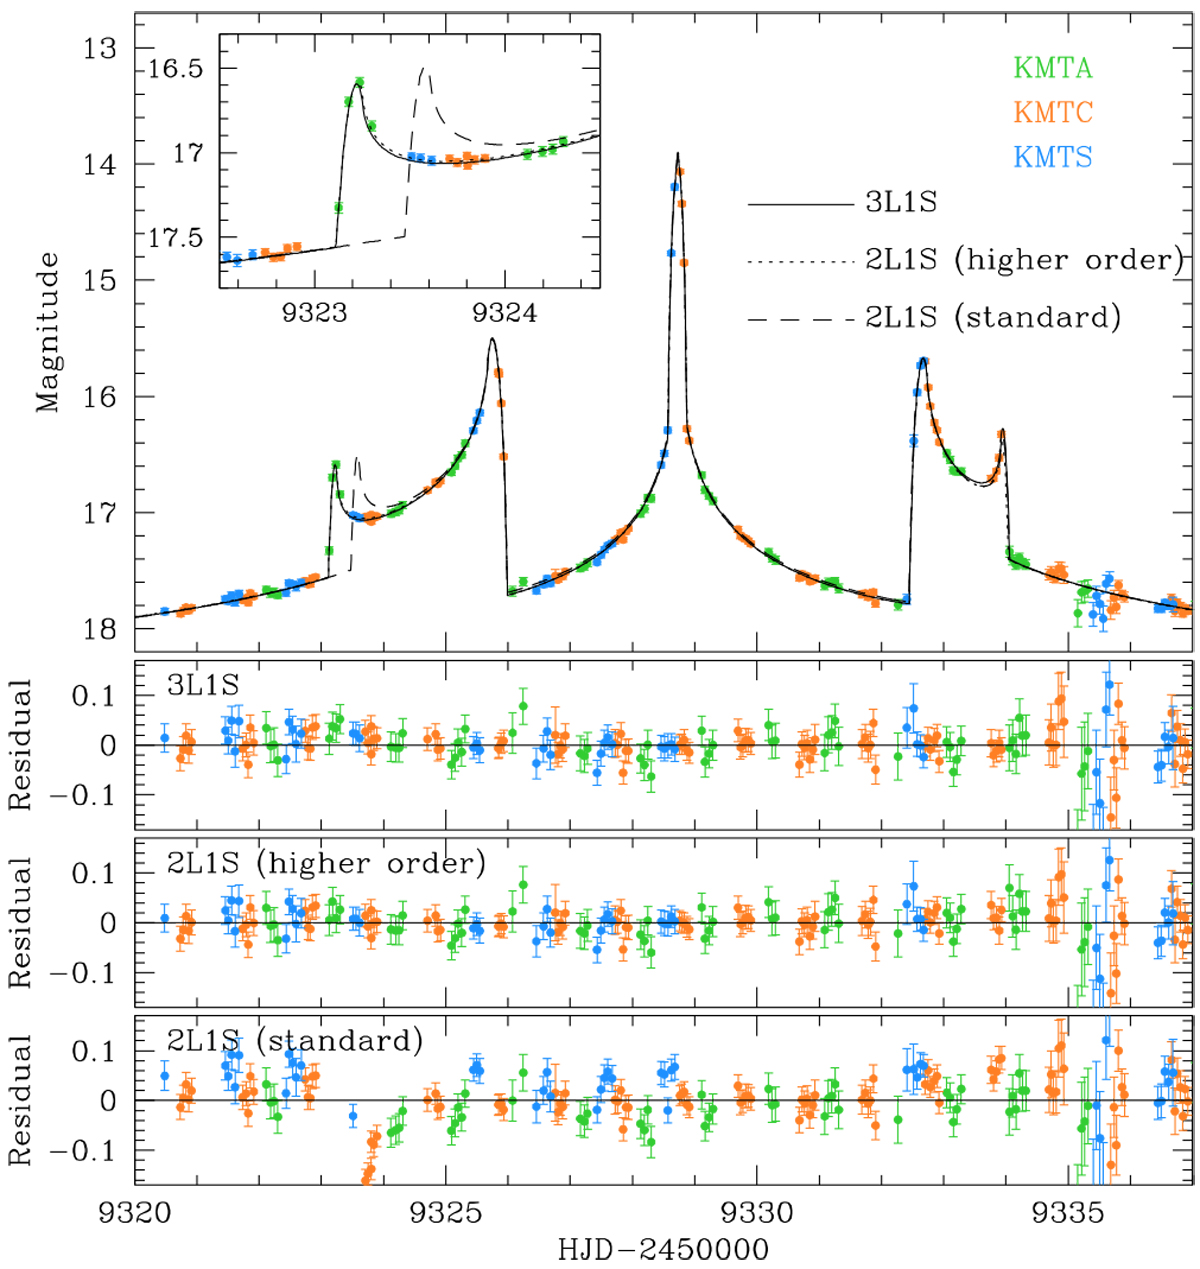
Zoom-in view of the anomaly region of the lensing light curve. The inset in the top panel shows the enlarged view around the first peak. The solid, dotted, and dashed curves drawn over the data points are the model curves of the 3L1S, higher-order 2L1S, and standard 2L1S solutions, respectively. The three lower panels show the residuals from the individual models. The curves of the 3L1S and higher-order 2L1S models are difficult to be distinguished with the line width.
Current usage metrics show cumulative count of Article Views (full-text article views including HTML views, PDF and ePub downloads, according to the available data) and Abstracts Views on Vision4Press platform.
Data correspond to usage on the plateform after 2015. The current usage metrics is available 48-96 hours after online publication and is updated daily on week days.
Initial download of the metrics may take a while.