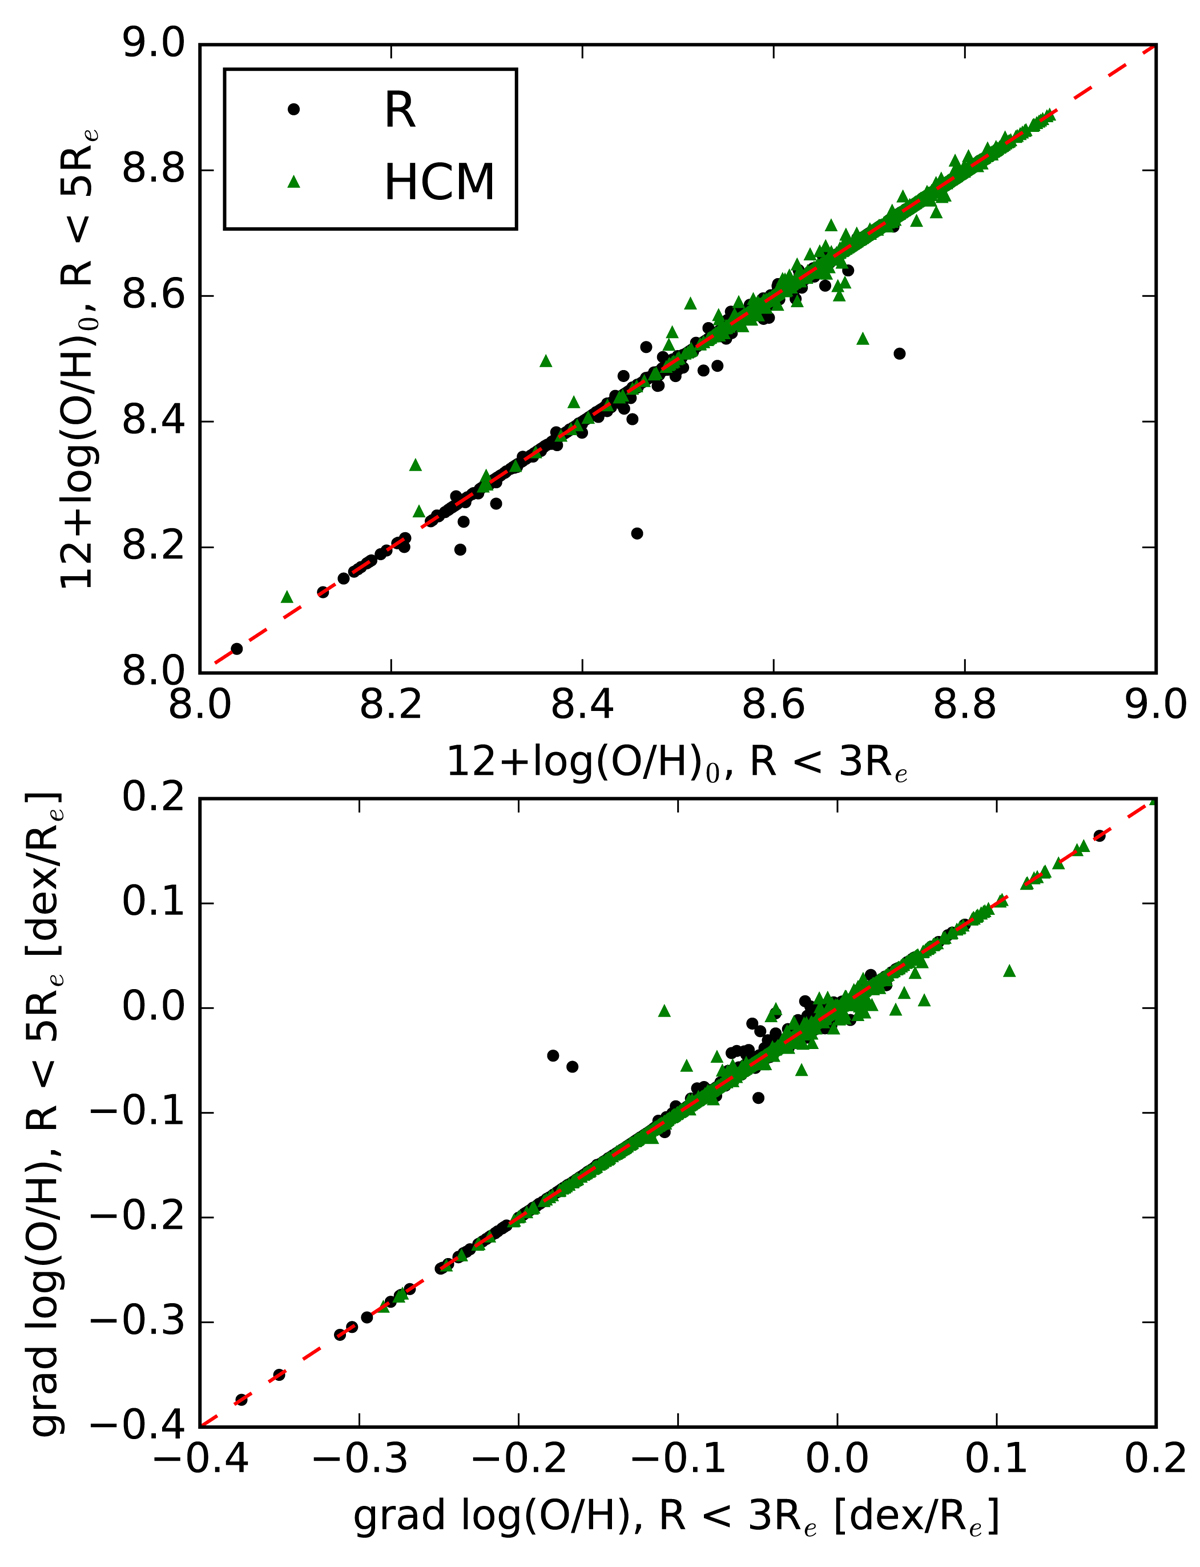
Fig. 3.
Download original image
Comparison between fits to the derived O/H radial distributions at a galactocentric radius less than 3Re (horizontal axes) and less than 5Re (vertical axes). Upper panel: comparison of the extrapolated O/H abundances in the galaxy centres. Lower panel: comparison of the slopes of the fits. The oxygen abundances and their corresponding gradients were derived using the following two methods: the R calibration (black circles) or the HCM code (green triangles). Dashed lines represent the one-to-one correspondence.
Current usage metrics show cumulative count of Article Views (full-text article views including HTML views, PDF and ePub downloads, according to the available data) and Abstracts Views on Vision4Press platform.
Data correspond to usage on the plateform after 2015. The current usage metrics is available 48-96 hours after online publication and is updated daily on week days.
Initial download of the metrics may take a while.