Free Access
Fig. C.1.
Download original image
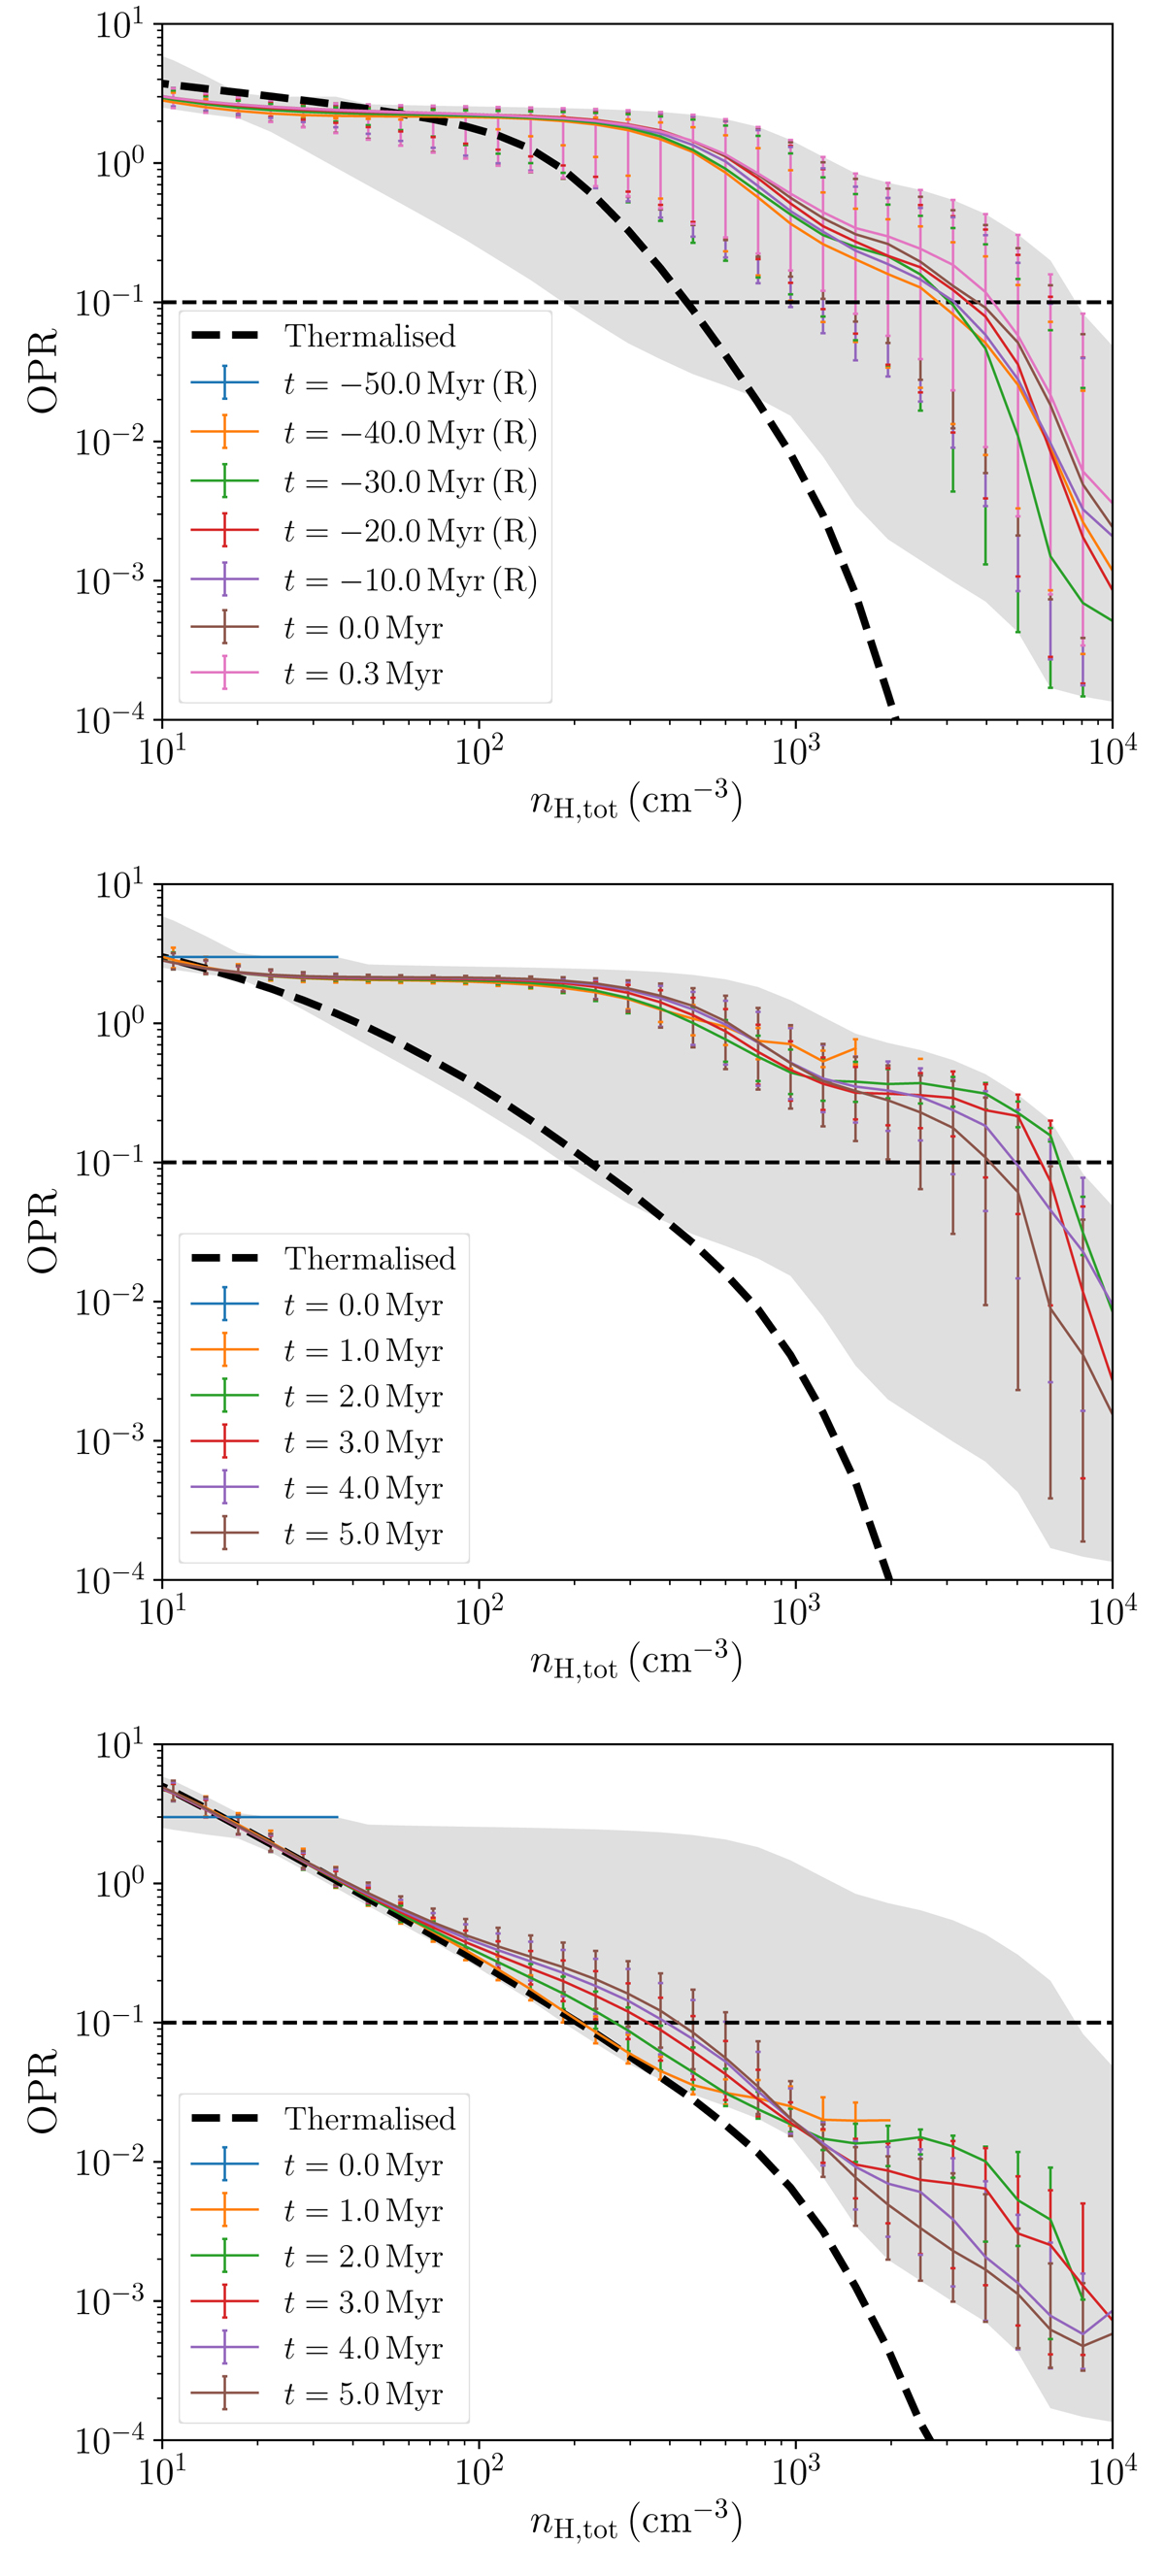
Same as Fig. 3, but for models RelaxChem_SG (top panel), RelaxIso_SG (middle panel), and RelaxIso_SG_OPdust (bottom panel). The OPR distribution shows very mild variations with time in all cases, with the values at nH, tot ∼ 104 cm−3 always being well below 0.1.
Current usage metrics show cumulative count of Article Views (full-text article views including HTML views, PDF and ePub downloads, according to the available data) and Abstracts Views on Vision4Press platform.
Data correspond to usage on the plateform after 2015. The current usage metrics is available 48-96 hours after online publication and is updated daily on week days.
Initial download of the metrics may take a while.