Fig. 2.
Download original image
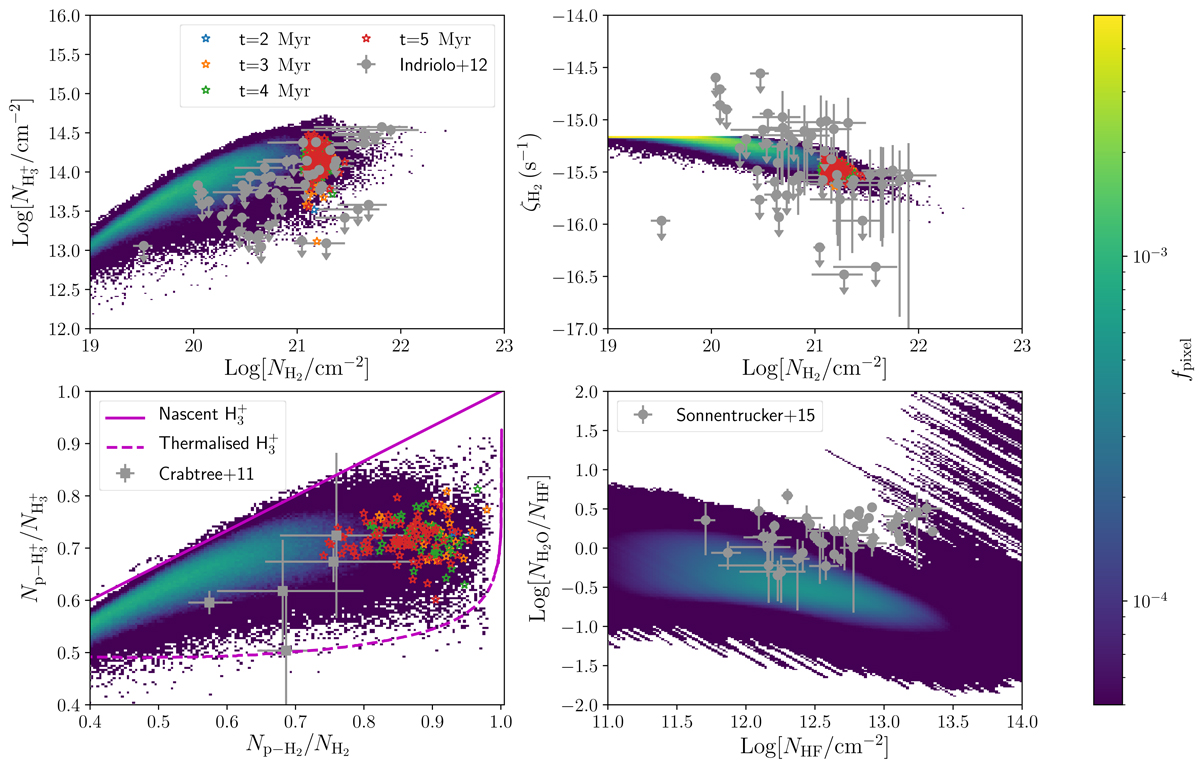
Comparison of our simulation with existing observations of diffuse clouds, shown as grey dots (Crabtree et al. 2011; Indriolo 2012; Sonnentrucker et al. 2015). Top left panel: abundance of ![]() relative to H2, top right panel: corresponding ζH2, bottom left panel: para-to-total ratio for both
relative to H2, top right panel: corresponding ζH2, bottom left panel: para-to-total ratio for both ![]() and H2, and bottom right panel: H2O relative abundance with respect to HF, where the HF column density in our simulation is extracted assuming a rigid scaling relative to H2 (Indriolo 2012) with scaling factors in the range 0.5 × 10⁻⁸ − 3.5 × 10⁻⁸. The coloured 2D histogram represents the full distribution of pixels (0.25 pc wide) in our simulation, and the blue, orange, green, and red stars the average abundances from the identified filaments at different times. Finally, the magenta lines correspond to the theoretical abundance of
and H2, and bottom right panel: H2O relative abundance with respect to HF, where the HF column density in our simulation is extracted assuming a rigid scaling relative to H2 (Indriolo 2012) with scaling factors in the range 0.5 × 10⁻⁸ − 3.5 × 10⁻⁸. The coloured 2D histogram represents the full distribution of pixels (0.25 pc wide) in our simulation, and the blue, orange, green, and red stars the average abundances from the identified filaments at different times. Finally, the magenta lines correspond to the theoretical abundance of ![]() assuming a nascent distribution (solid line), in which the formation of
assuming a nascent distribution (solid line), in which the formation of ![]() from cosmic-ray-induced ionisation of H2 fully determines the relative abundance of the nuclear spin values, and a thermalised distribution (dashed line), in which the relative abundance is dominated by collisional exchange between
from cosmic-ray-induced ionisation of H2 fully determines the relative abundance of the nuclear spin values, and a thermalised distribution (dashed line), in which the relative abundance is dominated by collisional exchange between ![]() and H2 (Crabtree et al. 2011).
and H2 (Crabtree et al. 2011).
Current usage metrics show cumulative count of Article Views (full-text article views including HTML views, PDF and ePub downloads, according to the available data) and Abstracts Views on Vision4Press platform.
Data correspond to usage on the plateform after 2015. The current usage metrics is available 48-96 hours after online publication and is updated daily on week days.
Initial download of the metrics may take a while.