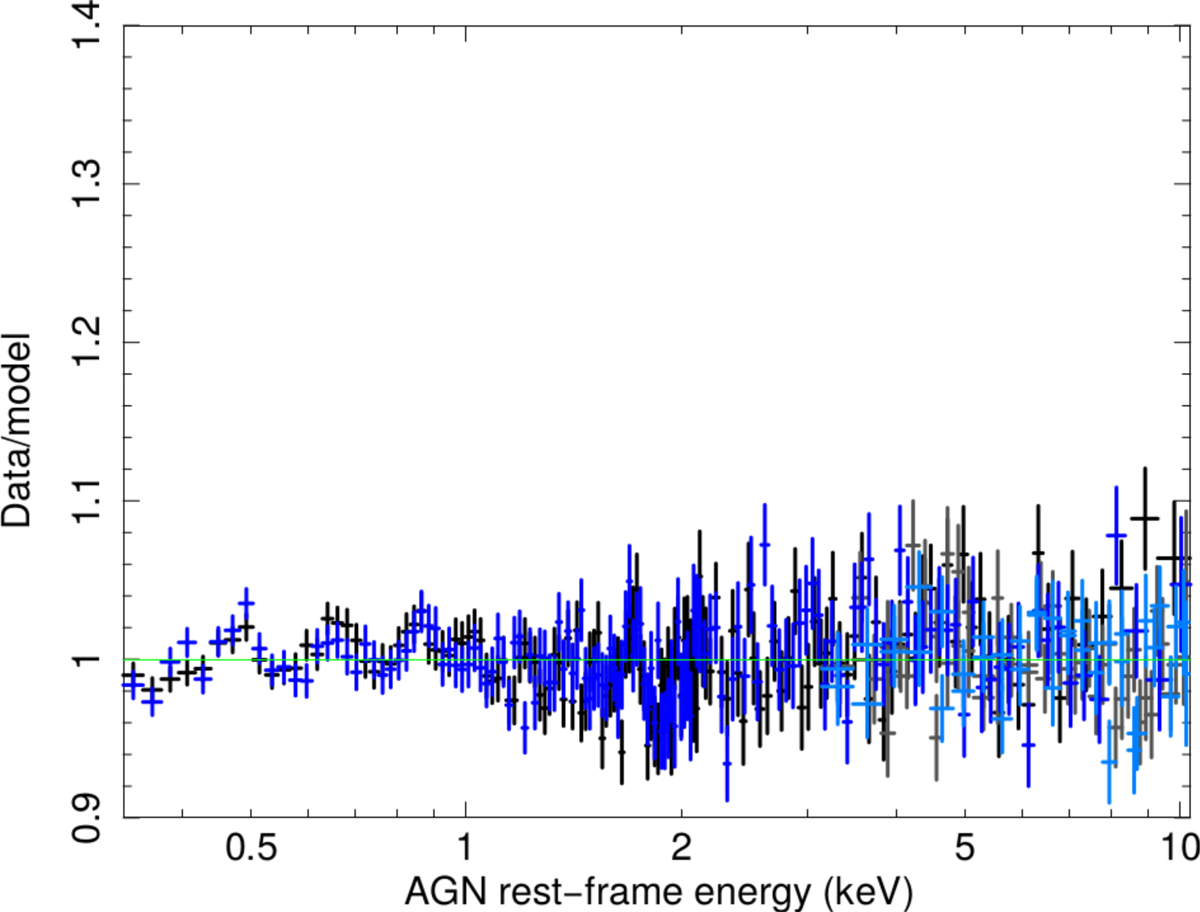
Fig. A.1.
Download original image
Data-to-model ratio of the two simultaneous 2019 and 2020 XMM-Newton/pn and NuSTAR spectra over the 0.3−10 keV energy range fit with the RELXILL model. The Y-axis range is identical to that of Fig. 4 for a direct comparison. Black: 2019 XMM-Newton/pn; dark grey: 2019 NuSTAR; blue: 2020 XMM-Newton/pn; light blue: 2020 NuSTAR. See Table A.1 for the corresponding inferred parameter values.
Current usage metrics show cumulative count of Article Views (full-text article views including HTML views, PDF and ePub downloads, according to the available data) and Abstracts Views on Vision4Press platform.
Data correspond to usage on the plateform after 2015. The current usage metrics is available 48-96 hours after online publication and is updated daily on week days.
Initial download of the metrics may take a while.