Fig. 6.
Download original image
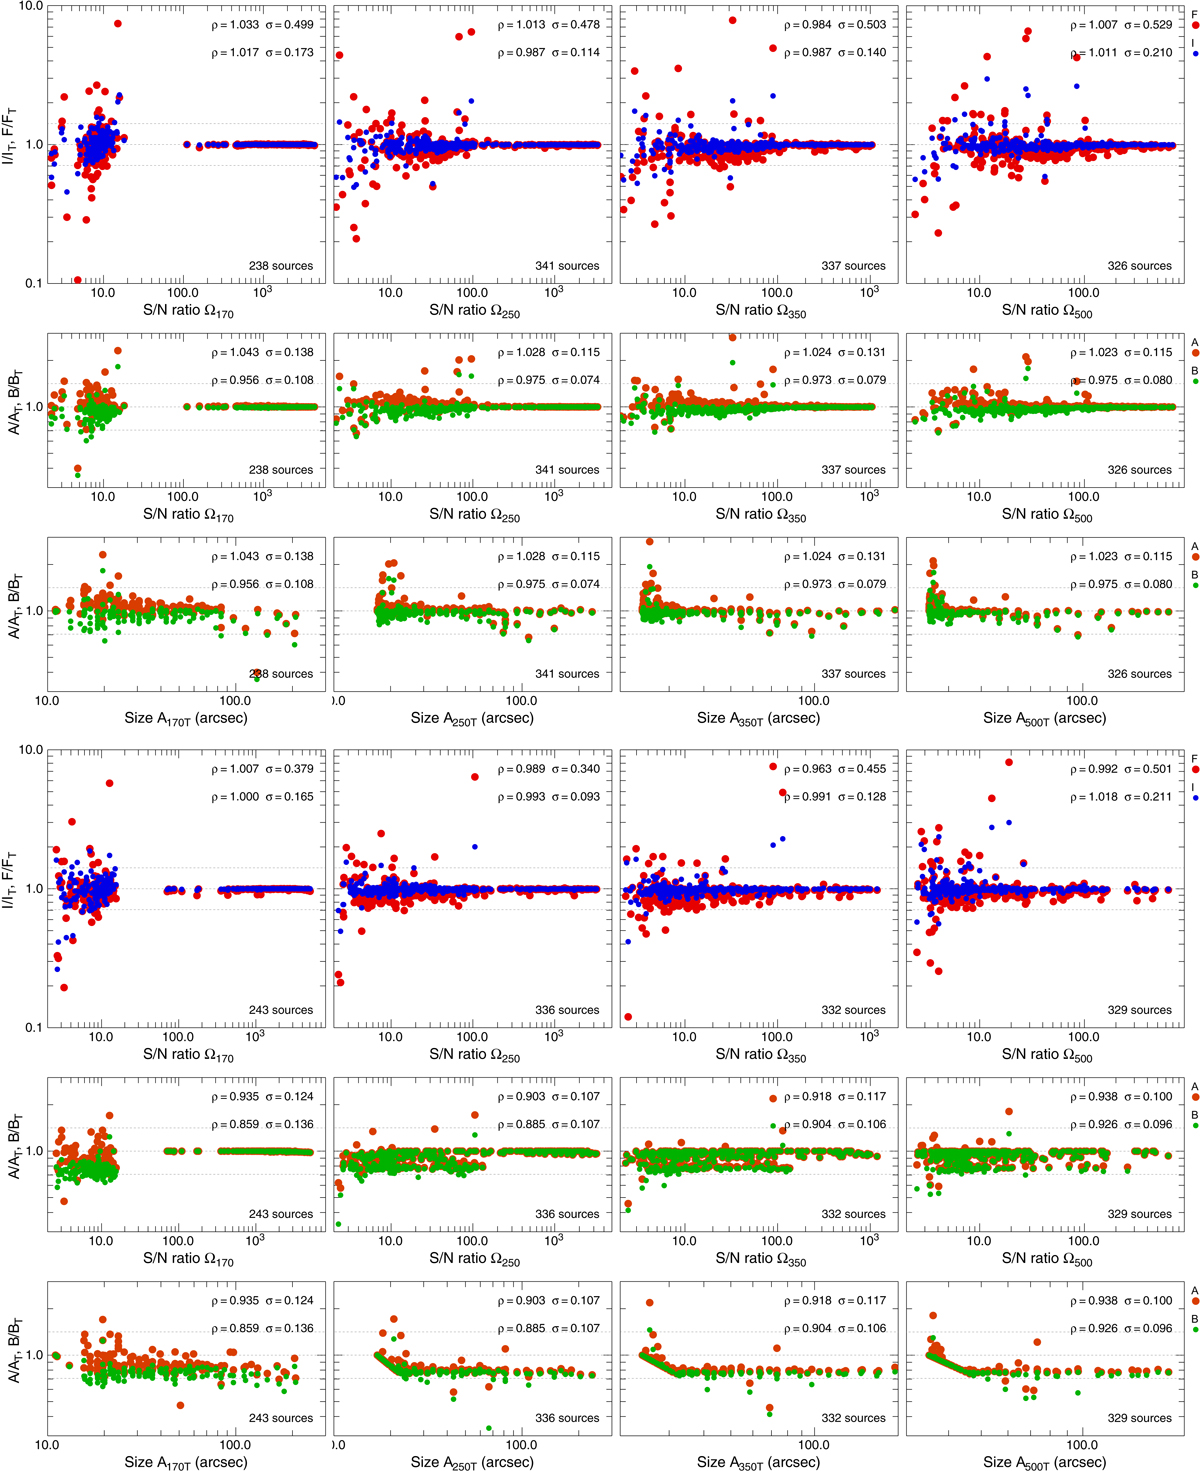
Benchmark A2 extraction with getsf (three top rows) and getold (three bottom rows). Ratios of the measured fluxes FTλn, peak intensities FPλn, and sizes {A, B}λn to their true values (F/FT, I/IT, A/AT, and B/BT) are shown as a function of the S/N ratio Ωλn. The size ratios A/AT and B/BT are also shown as a function of the true sizes {A, B}λnT. The mean 𝜚{P|T|A|B}λ and standard deviation σ{P|T|A|B}λ of the ratios are displayed in the panels. Similar plots for λ ≤ 110 μm with only bright protostellar cores are not presented, because their measurements are quite accurate, with 𝜚{P|T|A|B}λ ≈ {0.999|0.998|0.999|0.999} and σ{P|T|A|B}λ ≈ {0.002|0.006|0.00004|0.00004}.
Current usage metrics show cumulative count of Article Views (full-text article views including HTML views, PDF and ePub downloads, according to the available data) and Abstracts Views on Vision4Press platform.
Data correspond to usage on the plateform after 2015. The current usage metrics is available 48-96 hours after online publication and is updated daily on week days.
Initial download of the metrics may take a while.