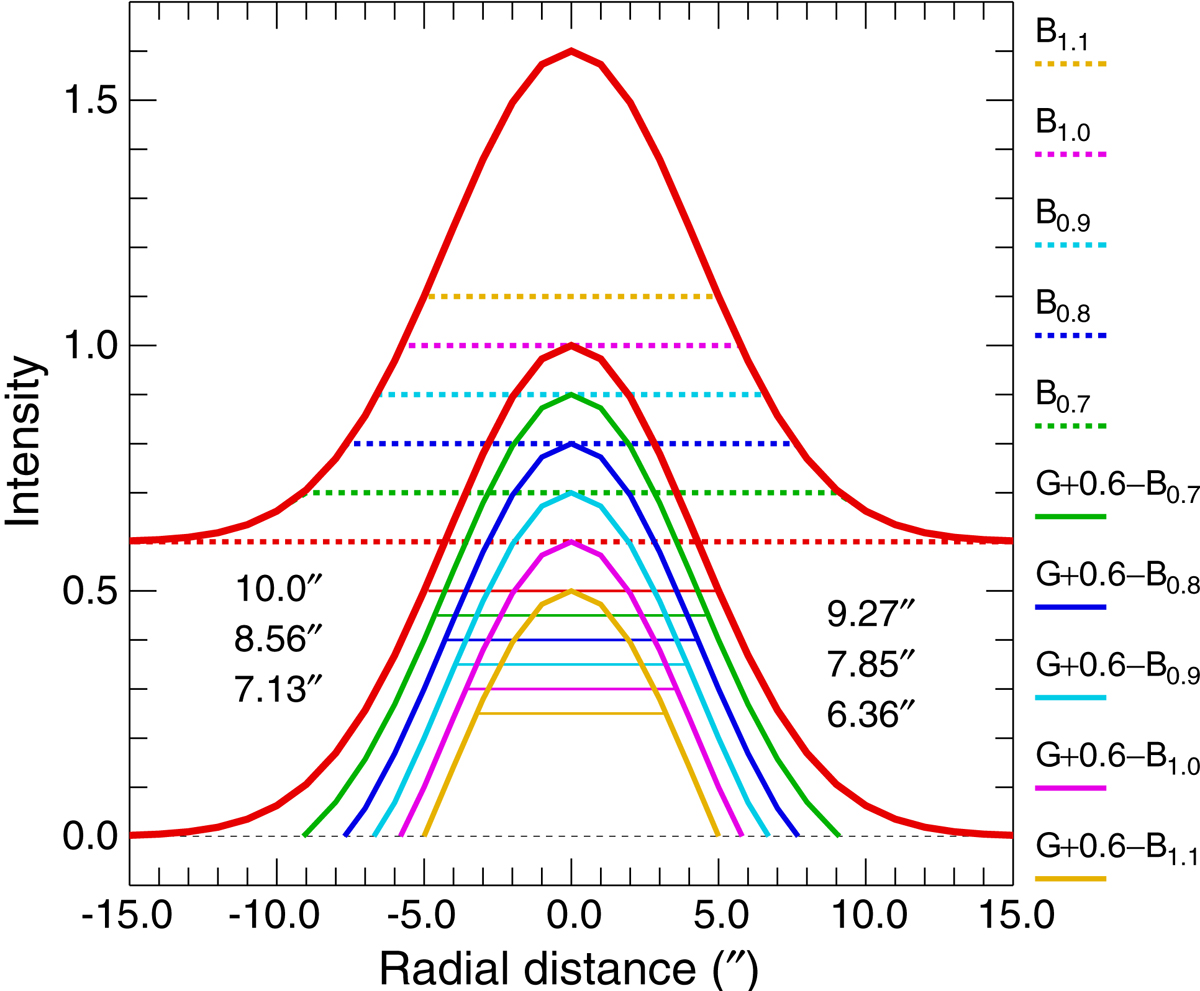
Fig. B.1.
Download original image
Approximate corrections for unresolved or slightly resolved sources with overestimated backgrounds. The model Gaussian source 𝒢 with a size of 10″ (FWHM) and a peak intensity of 1 is superposed on a flat background with a constant intensity of ℬ0.9 = 0.6 (upper red lines). The increasingly overestimated backgrounds ℬ0.7, ℬ0.8, ℬ0.9, ℬ1.0, and ℬ1.1 are shown with the dotted lines of different color. When such backgrounds are subtracted (lower colored curves), the source FWHM sizes A, peak intensities FP, and total fluxes FT become increasingly underestimated. The measured A values (given in the plot) get progressively smaller than the angular resolution of 10″, which clearly indicates an increasing inaccuracy of the background. Requiring that a source cannot be narrower than the telescope beam, it is possible to improve the measurements, substantially reducing their errors.
Current usage metrics show cumulative count of Article Views (full-text article views including HTML views, PDF and ePub downloads, according to the available data) and Abstracts Views on Vision4Press platform.
Data correspond to usage on the plateform after 2015. The current usage metrics is available 48-96 hours after online publication and is updated daily on week days.
Initial download of the metrics may take a while.