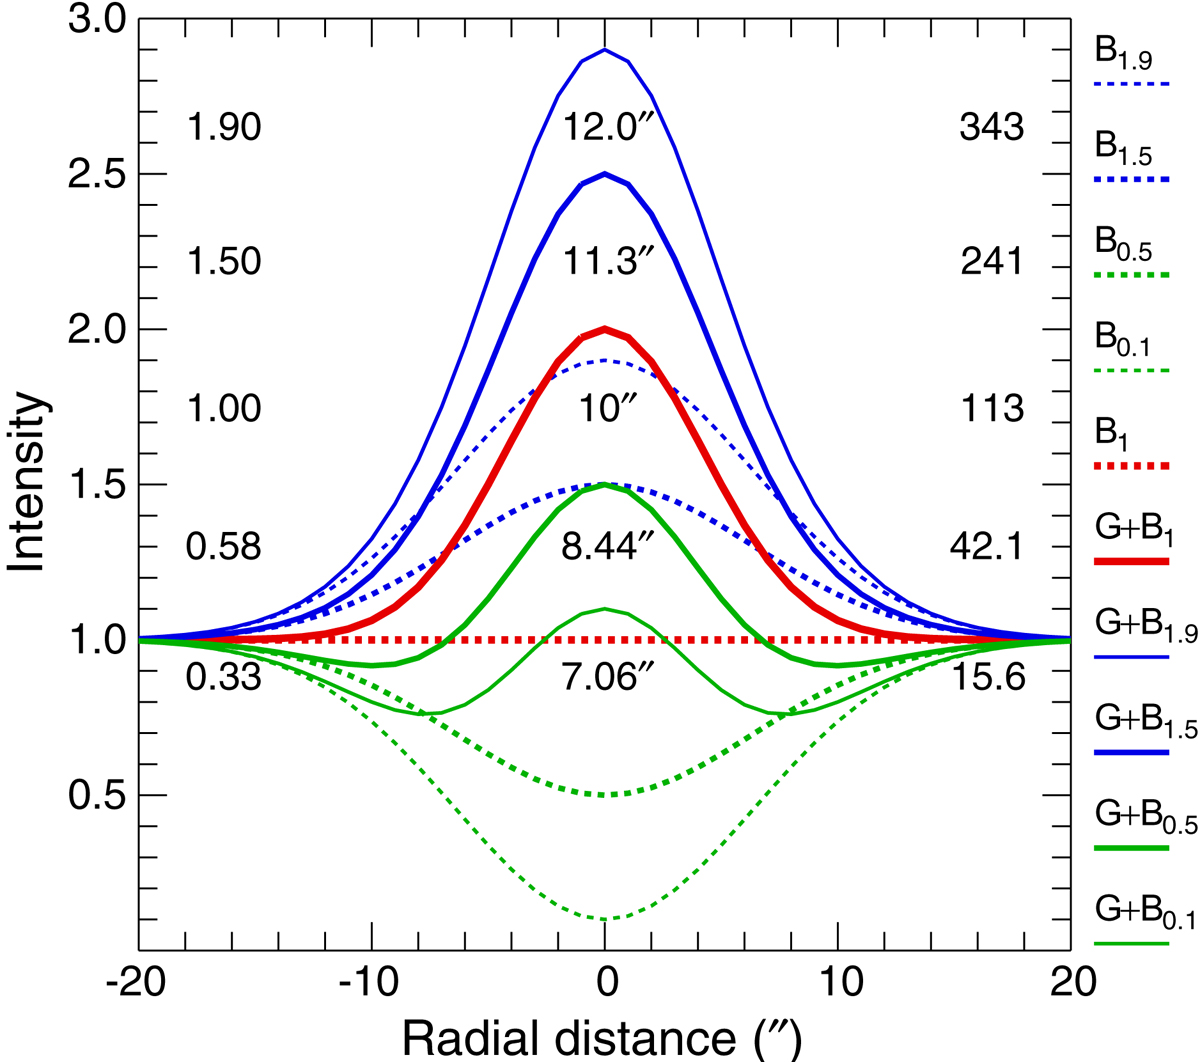
Fig. A.1.
Download original image
Fluctuating backgrounds and measurements of faint sources. The model Gaussian source 𝒢 with a size of 10″ (FWHM) and a peak intensity of 1 corresponds to the flat background ℬ1 = 1 (red lines). The same source 𝒢 is also added to the nonuniform (hill- and hollow-like) backgrounds ℬ1.9, ℬ1.5, ℬ0.5, and ℬ0.1 (blue and green lines). The fluctuating backgrounds were obtained from the flat background ℬ1 by adding or subtracting the Gaussians with a size of 15″ (FWHM) and the peak values of 0.5 and 0.9. Extraction methods would not be able to recognize that the real backgrounds are hill- or hollow-like, hence they would instead subtract the flat backgrounds, based on the intensities just outside the apparent source footprints. Therefore, the source 𝒢 would be extracted with over- or underestimated FWHM sizes A, peak intensities FP, and total fluxes FT (the middle, left, and right columns of numbers, respectively).
Current usage metrics show cumulative count of Article Views (full-text article views including HTML views, PDF and ePub downloads, according to the available data) and Abstracts Views on Vision4Press platform.
Data correspond to usage on the plateform after 2015. The current usage metrics is available 48-96 hours after online publication and is updated daily on week days.
Initial download of the metrics may take a while.