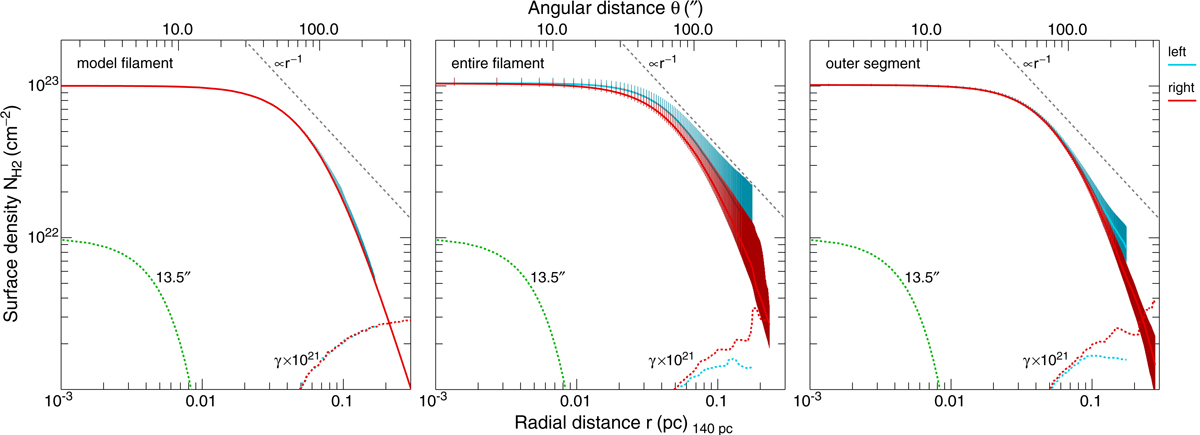
Fig. 14.
Download original image
Benchmark B4 extraction of filaments with getsf. Plotted are the one-sided (left and right) profiles D{α|β}(r) of the filament surface densities ℱƛY, their slopes γ{α|β}(r), multiplied by 1021 for convenience, the reference line with a slope of −1, and the Gaussian beam with the half-maximum width OH = 13.5″. The profiles represent the median densities along the skeleton and the vertical bars are their positive and negative deviations ς{α|β}±(r) about the median profile. The left panel shows the true profiles of the simulated filament 𝒟F across its crest. The middle panel presents the profiles, measured in the ℱƛY component of 𝒟13″ along the entire detected skeleton length (Fig. 13). The right panel displays the more accurate profiles, measured across the outermost skeleton loop, where the filament is least affected by the inaccuracies of its background.
Current usage metrics show cumulative count of Article Views (full-text article views including HTML views, PDF and ePub downloads, according to the available data) and Abstracts Views on Vision4Press platform.
Data correspond to usage on the plateform after 2015. The current usage metrics is available 48-96 hours after online publication and is updated daily on week days.
Initial download of the metrics may take a while.