Fig. 12.
Download original image
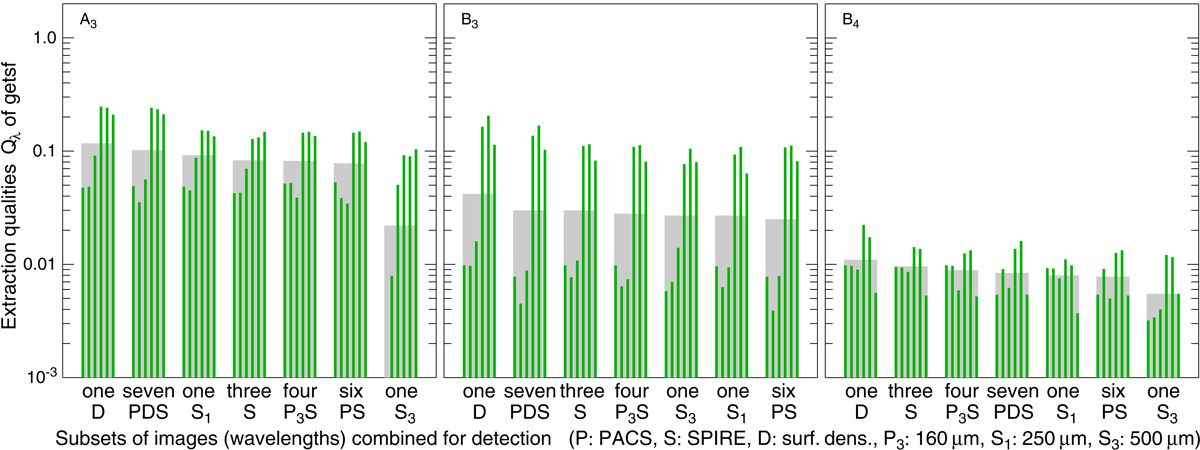
Overview of the dependence of the getsf extraction qualities (Tables C.3–C.5) on various subsets of wavelengths (images) used in detecting sources (cf. Sects. 3.4.3 and 3.4.4 of Paper I) in benchmarks A3, B3, and B4. The overall qualities Qλ from Eq. (6) are represented by the green vertical bars for each wavelength (3 PACS and 3 SPIRE bands), with an exception of the fictitious ƛ of the surface density 𝒟{11|13}″. The results for the subsets are annotated on the horizontal axis with the number of images used for detection. In each panel, the getsf extractions are sorted in the order of their decreasing global quality Q, defined as the geometric mean over the wavelengths and represented by the wide gray bars.
Current usage metrics show cumulative count of Article Views (full-text article views including HTML views, PDF and ePub downloads, according to the available data) and Abstracts Views on Vision4Press platform.
Data correspond to usage on the plateform after 2015. The current usage metrics is available 48-96 hours after online publication and is updated daily on week days.
Initial download of the metrics may take a while.