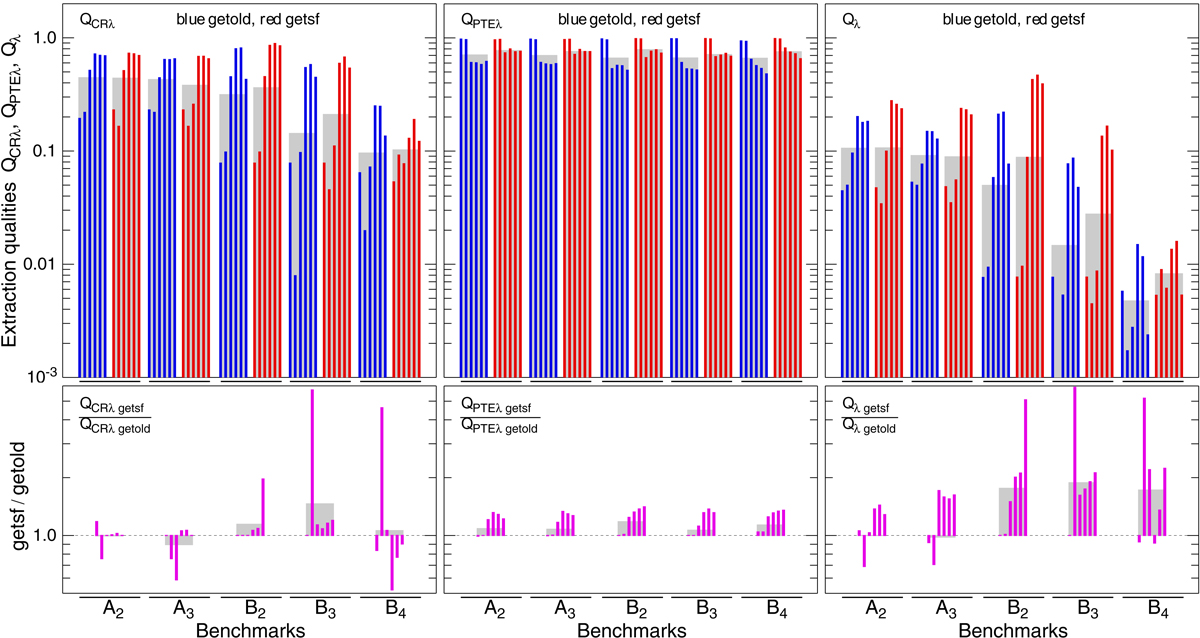
Fig. 11.
Download original image
Overview of the benchmarking results for the source extractions with getold and getsf (Tables C.1 and C.2). The top panels show the detection quality QCRλ, the measurement quality QPTEλ, and the overall quality Qλ from Eq. (6), represented by vertical bars for each wavelength (3 PACS and 3 SPIRE bands, from left to right), with an exception of the fictitious ƛ of the surface density 𝒟{11|13}″. The global qualities of the methods, QCR, QPTE, and Q, defined as the geometric means over the wavelengths, are represented by the wide gray bars. The bottom panels help visualize the ratios of the qualities for the getsf and getold extractions for each benchmark and wavelength.
Current usage metrics show cumulative count of Article Views (full-text article views including HTML views, PDF and ePub downloads, according to the available data) and Abstracts Views on Vision4Press platform.
Data correspond to usage on the plateform after 2015. The current usage metrics is available 48-96 hours after online publication and is updated daily on week days.
Initial download of the metrics may take a while.