Fig. 11.
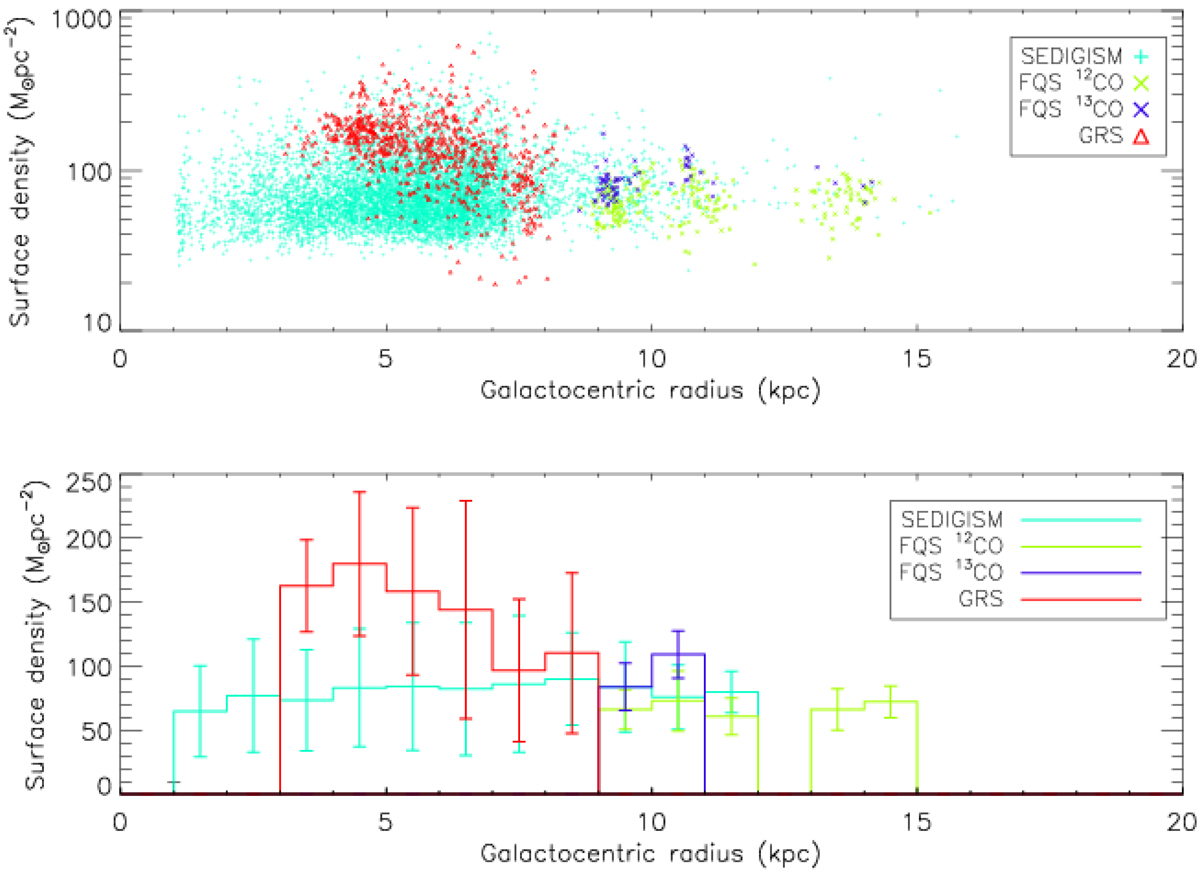
Download original image
Top: mass surface density vs. galactocentric radius for the MCs of the SEDIGISM catalogue (cyan plus, Duarte-Cabral et al. 2021), FQS 12CO catalogue (green crosses, Paper I), FQS 13CO catalogue (blue crosses, this paper), and GRS (red triangles, Roman-Duval et al. 2010). Bottom: histograms of the mean value of the data shown in the top panel in 1 kpc bins, for bins with more than ten sources. The error bars are the statistical standard deviations in each bin.
Current usage metrics show cumulative count of Article Views (full-text article views including HTML views, PDF and ePub downloads, according to the available data) and Abstracts Views on Vision4Press platform.
Data correspond to usage on the plateform after 2015. The current usage metrics is available 48-96 hours after online publication and is updated daily on week days.
Initial download of the metrics may take a while.