Free Access
Fig. 2.
Download original image
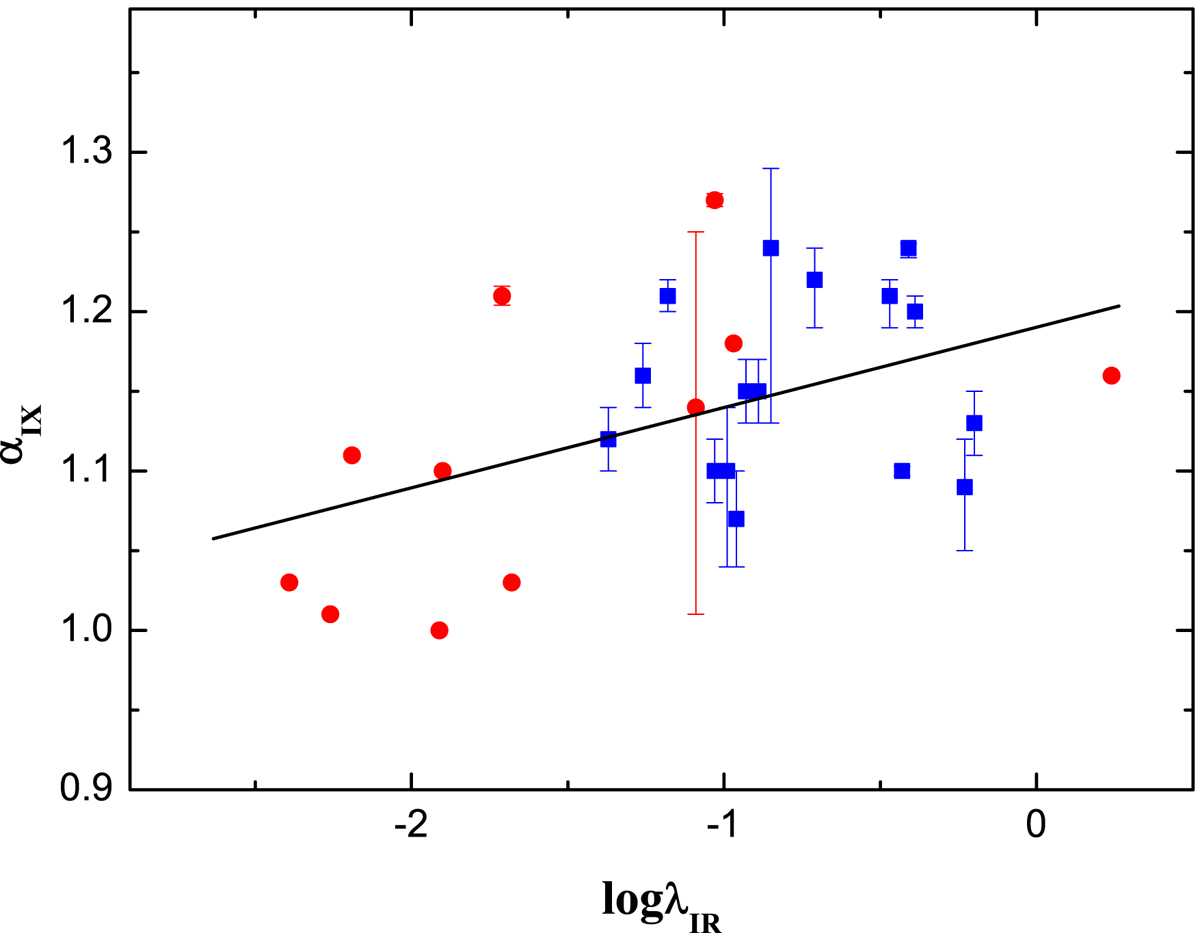
Mid-infrared to X-ray spectral index αIX as a function of Eddington ratio λIR based on mid-infrared emission for RLAGNs, where the red circle and blue square represent the narrow-line radio galaxies and quasars, respectively. The black solid line shows the best fit given by Eq. (2).
Current usage metrics show cumulative count of Article Views (full-text article views including HTML views, PDF and ePub downloads, according to the available data) and Abstracts Views on Vision4Press platform.
Data correspond to usage on the plateform after 2015. The current usage metrics is available 48-96 hours after online publication and is updated daily on week days.
Initial download of the metrics may take a while.