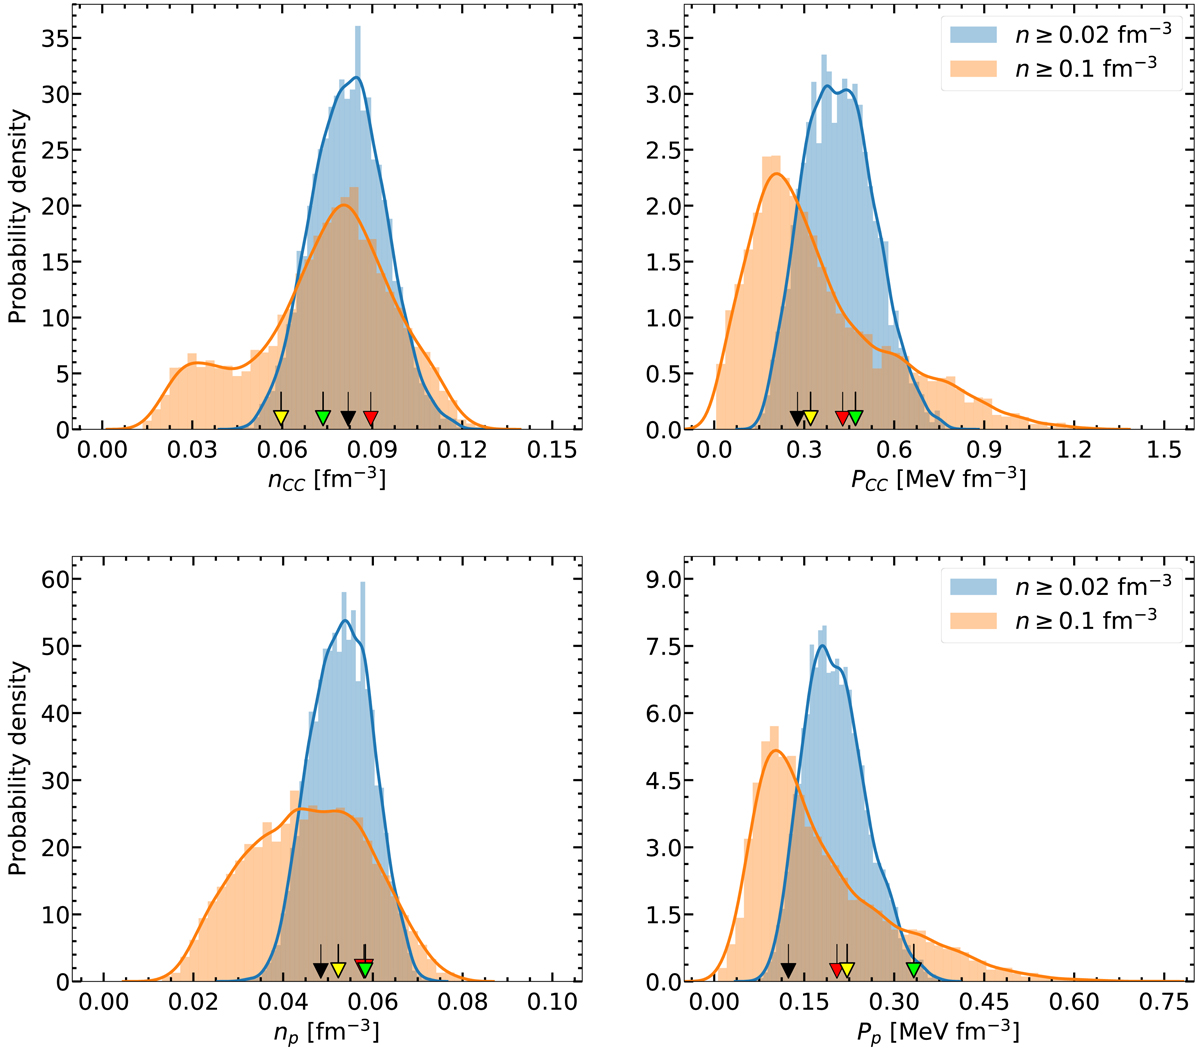
Fig. 4.
Download original image
Posterior distributions of crust-core (top panels) and sphere-pasta (lower panels) transition density (left panels) and pressure (right panels), obtained considering different density intervals for the application of the chiral EFT constraint. Arrows correspond to the predictions of some selected models: BSk24 (black), RATP (red), DD-ME2 (green), and TM1 (yellow) (see text for details).
Current usage metrics show cumulative count of Article Views (full-text article views including HTML views, PDF and ePub downloads, according to the available data) and Abstracts Views on Vision4Press platform.
Data correspond to usage on the plateform after 2015. The current usage metrics is available 48-96 hours after online publication and is updated daily on week days.
Initial download of the metrics may take a while.