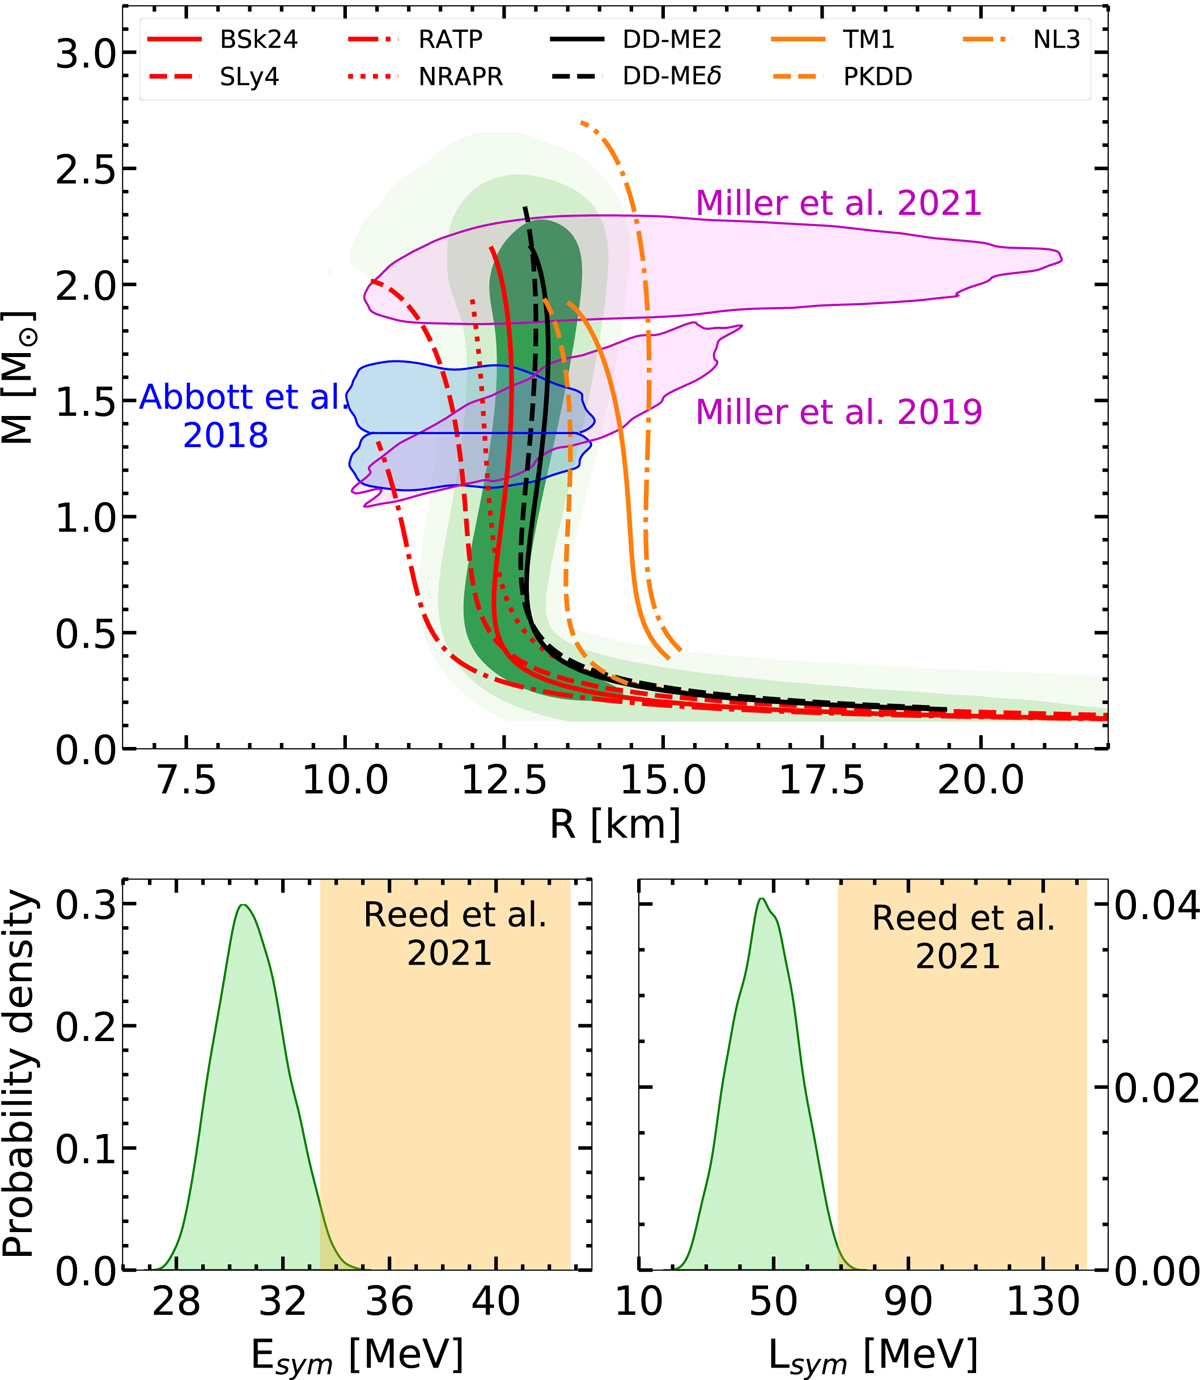
Fig. 3.
Download original image
Top panel: marginalised posterior distribution for the neutron-star gravitational mass as a function of radius for the models including both the low- and high-density filters. The shaded areas correspond to the 1σ, 2σ, and 3σ (from dark to light green) confidence intervals, while lines show the mass-radius relation for different selected models. The pink (blue) shaded areas represent the constraint from Miller et al. (2019, 2021) (Abbott et al. 2018) at 2σ. Bottom panels: marginalised posterior distributions for the symmetry energy at saturation, Esym (left panel), and its slope, Lsym (right panel). The shaded rectangles show the values of Esym and Lsym from Reed et al. (2021) (see text for details).
Current usage metrics show cumulative count of Article Views (full-text article views including HTML views, PDF and ePub downloads, according to the available data) and Abstracts Views on Vision4Press platform.
Data correspond to usage on the plateform after 2015. The current usage metrics is available 48-96 hours after online publication and is updated daily on week days.
Initial download of the metrics may take a while.