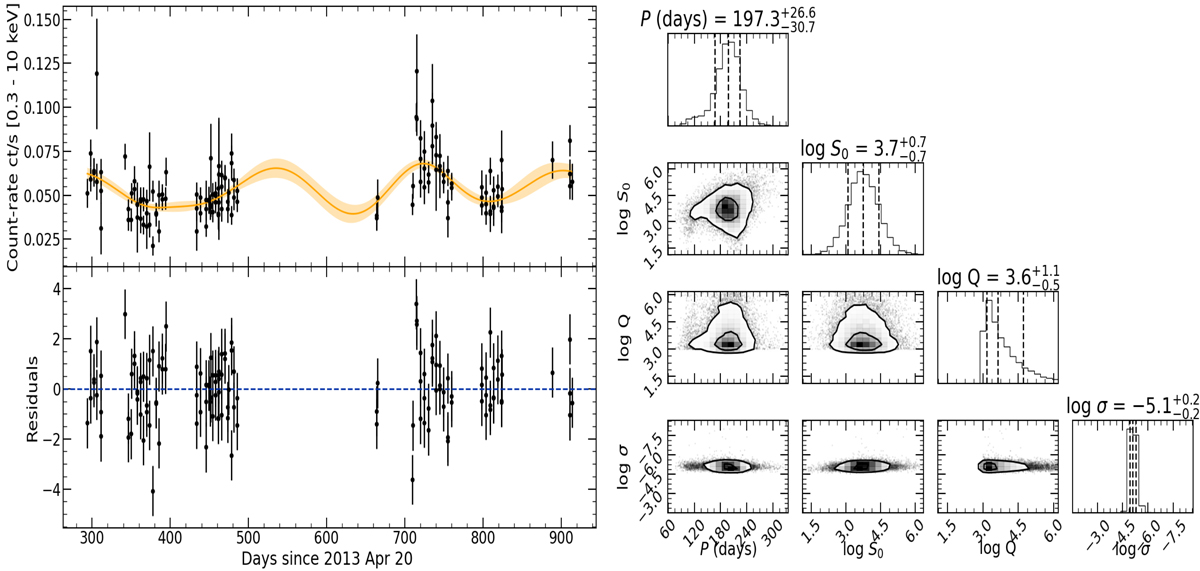
Fig. 8.
Download original image
Left: best-fit solution of the celerite modelling (orange solid line) with the 1σ shaded contours for the light curve of NGC 5204 X–1. The model shows the SHO with additional white noise (model b), for which we only show the oscillatory component. Right: posterior probability distributions of the parameters of the celerite model. The histograms along the diagonal show the marginalised posterior distribution for each parameter with dashed lines indicating the median and the 1σ errors. The two-dimensional histograms show the marginalised regions for each pair of parameters with the contours showing the 1 and 2σ confidence intervals.
Current usage metrics show cumulative count of Article Views (full-text article views including HTML views, PDF and ePub downloads, according to the available data) and Abstracts Views on Vision4Press platform.
Data correspond to usage on the plateform after 2015. The current usage metrics is available 48-96 hours after online publication and is updated daily on week days.
Initial download of the metrics may take a while.