Fig. 7.
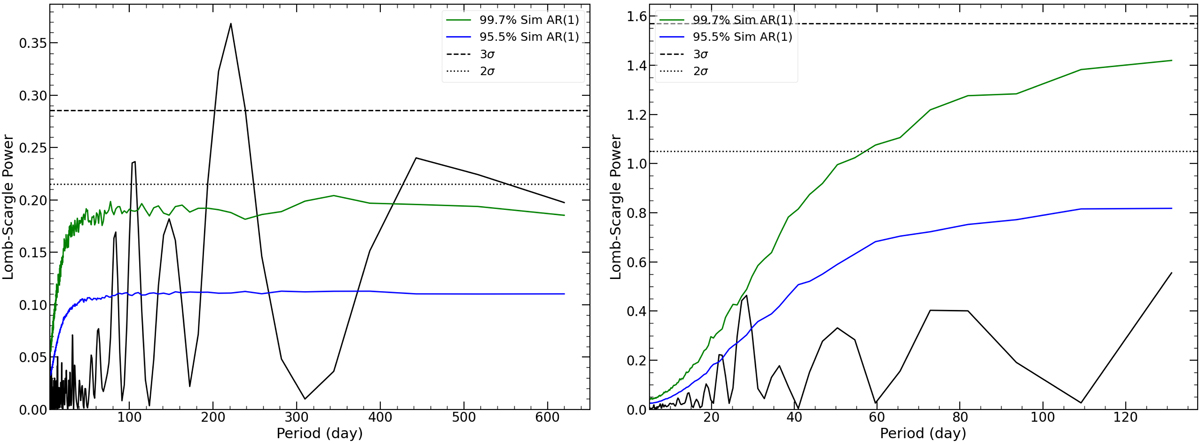
Download original image
False-alarm probabilities for the Lomb–Scargle periodogram based on an adaptation of the REFIT code (see text for details) for NGC 5204 X–1 (left) for the 2014−2015 monitoring and for Holmberg II X–1 (right) for the 2009−2010 monitoring under the null-hypothesis of red noise. The coloured 95.5% and 99.7% mark the distribution of the 10 000 synthetic periodograms, whereas the black dashed line marks 2σ and 3σ false-alarm probabilities, which have been determined from the maximum of the peaks of the synthetic periodograms.
Current usage metrics show cumulative count of Article Views (full-text article views including HTML views, PDF and ePub downloads, according to the available data) and Abstracts Views on Vision4Press platform.
Data correspond to usage on the plateform after 2015. The current usage metrics is available 48-96 hours after online publication and is updated daily on week days.
Initial download of the metrics may take a while.