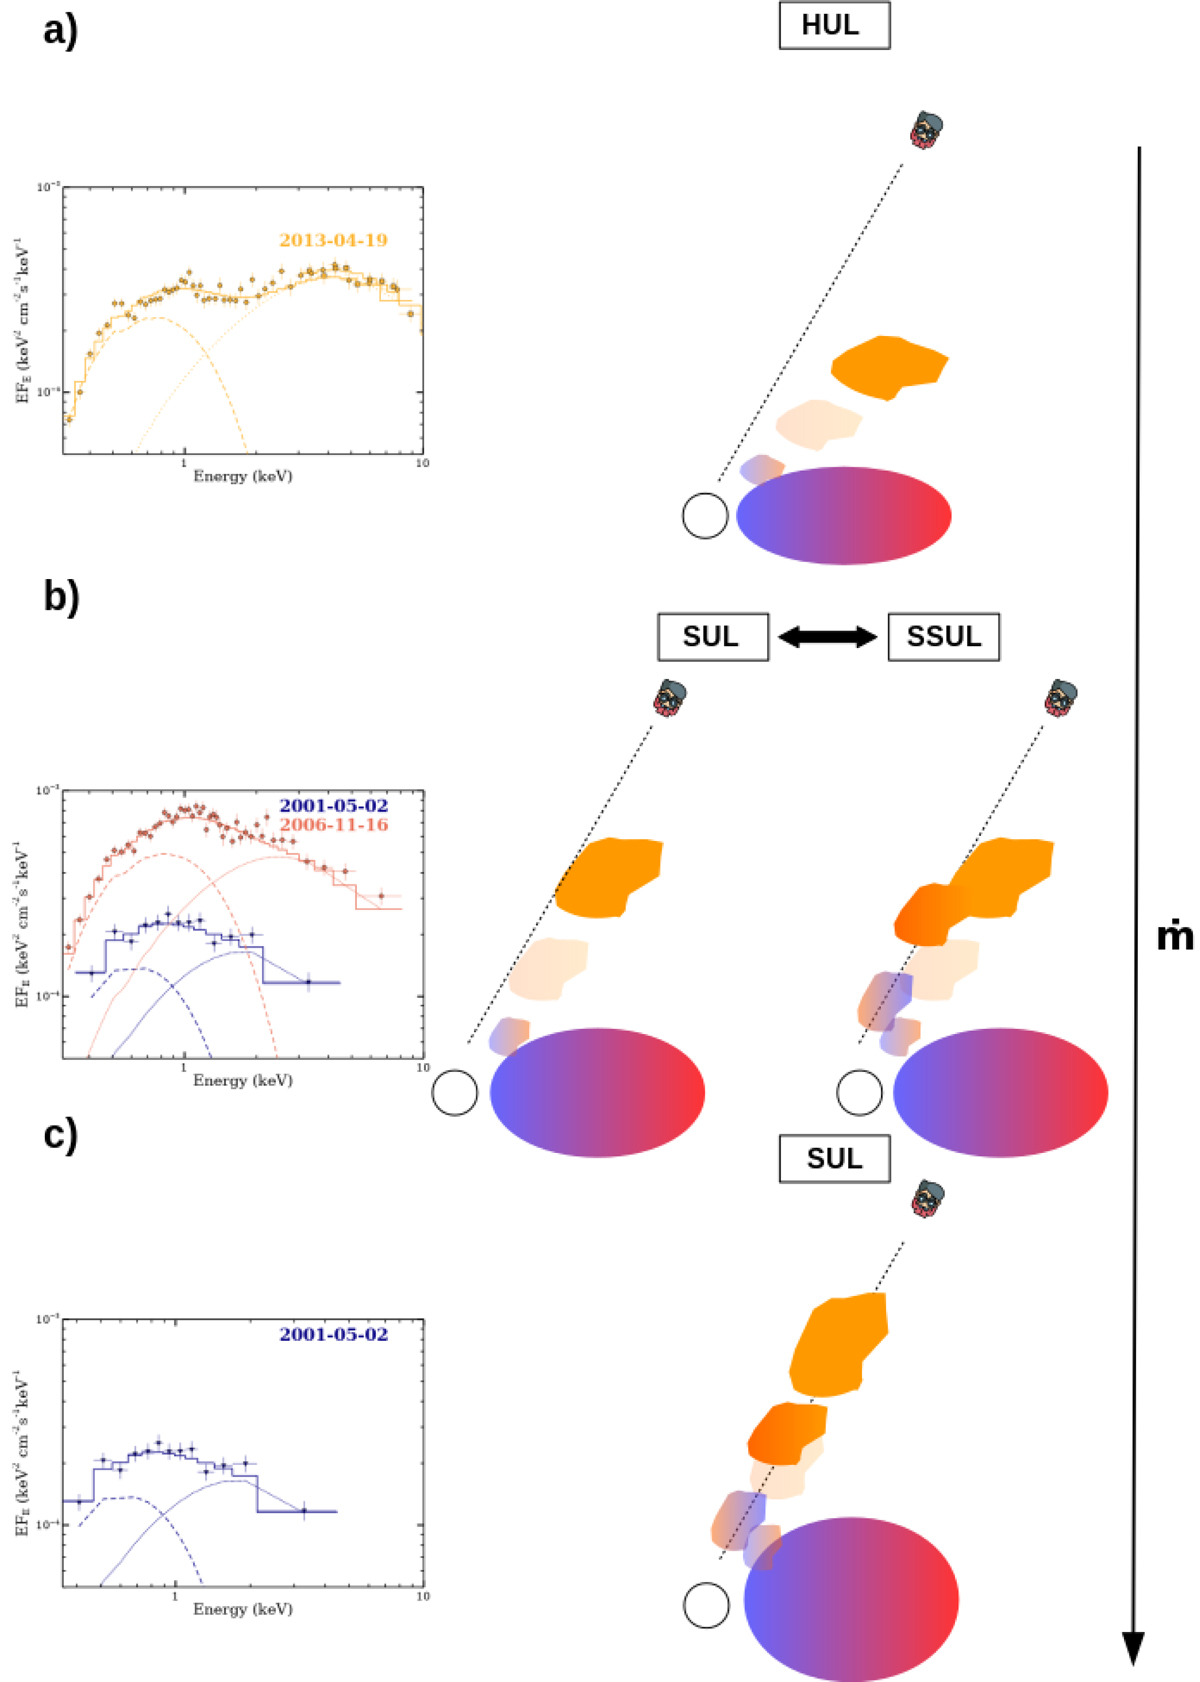
Fig. 10.
Download original image
Cartoon illustrating the different spectral states observed in Holmberg II X–1 and NGC 5204 X–1 as a function of the mass-transfer rate and wind clumps crossing the line of sight. The compact object (NS or a BH) is represented by a white sphere. From top to bottom, the mass transfer increases as indicated by the black arrow on the right. In panel a, the funnel is wide open due to the low accretion rate, and the observer sees the inner regions of the accretion flow and little variability is observed (HUL regime; 2019 Swift monitoring of Holmberg II X–1), because the wind is unlikely to enter the line of sight. The left graph shows the corresponding spectral state (adapted from Gúrpide et al. 2021). In panel b, the mass-transfer rate increases and narrows the opening angle of the funnel (SUL regime; SSUL regime), so wind clumps might now start to enter the line of sight and produce the spectral changes from soft to the SSUL regime observed (right and left panels and as seen in the 2009 Swift monitoring of Holmberg II X–1). Finally, in panel c, the mass-transfer rate increases further and the wind cone is now in the line of sight. The observer mostly sees the wind and the colder outer parts of the inflated disc, so the effect of absorption by wind clumps is dampened (end of the 2009−2010 Swift monitoring of Holmberg II X–1).
Current usage metrics show cumulative count of Article Views (full-text article views including HTML views, PDF and ePub downloads, according to the available data) and Abstracts Views on Vision4Press platform.
Data correspond to usage on the plateform after 2015. The current usage metrics is available 48-96 hours after online publication and is updated daily on week days.
Initial download of the metrics may take a while.