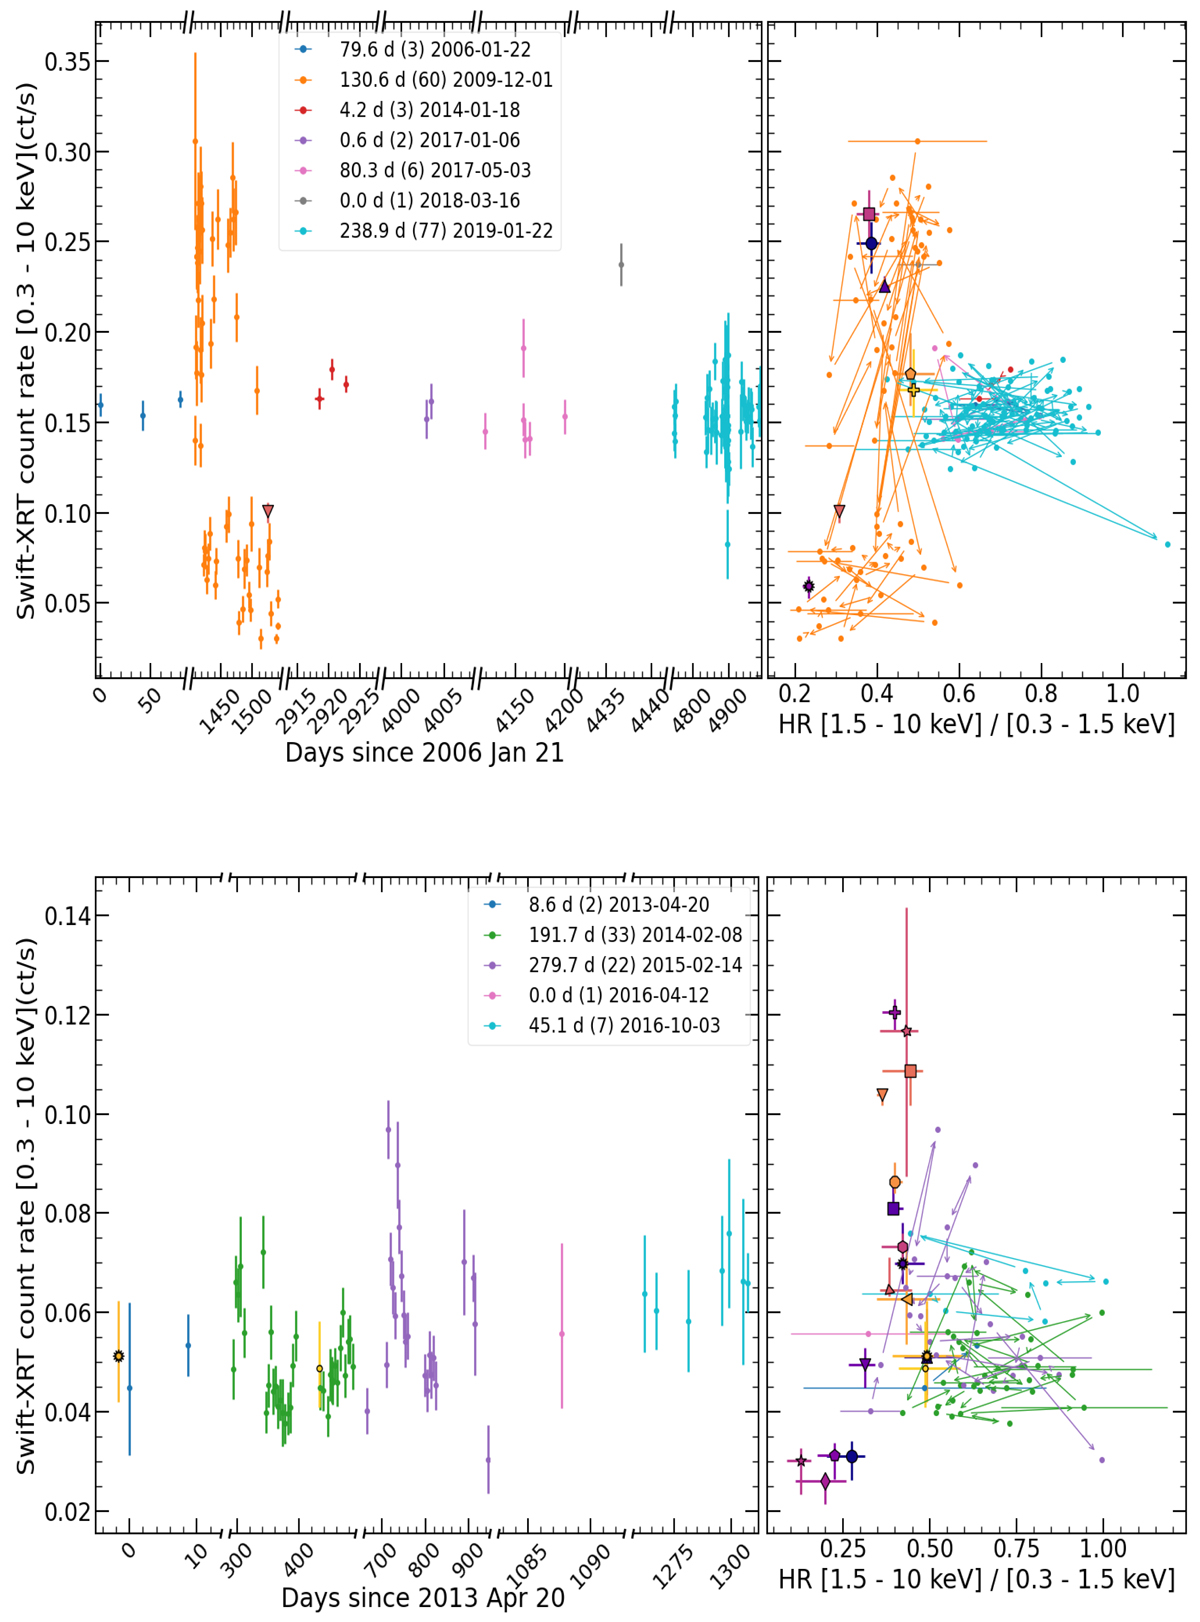
Fig. 1.

Download original image
Left: Swift-XRT light curve in the 0.3−10 keV band for Holmberg II X–1 (top) and NGC 5204 X–1 (bottom) with its associated HID (right). Continuous monitoring intervals with data gaps of less than 12 weeks have been coloured accordingly and the legend indicates the duration in days, the number of observations, and starting date of each continuous period. Arrows in the HID indicate chronological order and errors are given every eight datapoints for clarity. Big coloured markers correspond to the Swift-XRT 0.3−10 keV count-rate estimates of the XMM-Newton and Chandra observations based on best-fit models from Gúrpide et al. (2021) (see text for details). Errors are at 1σ confidence level. We note that the x-axis has been split on the left panels.
Current usage metrics show cumulative count of Article Views (full-text article views including HTML views, PDF and ePub downloads, according to the available data) and Abstracts Views on Vision4Press platform.
Data correspond to usage on the plateform after 2015. The current usage metrics is available 48-96 hours after online publication and is updated daily on week days.
Initial download of the metrics may take a while.


