Open Access
Fig. 28.
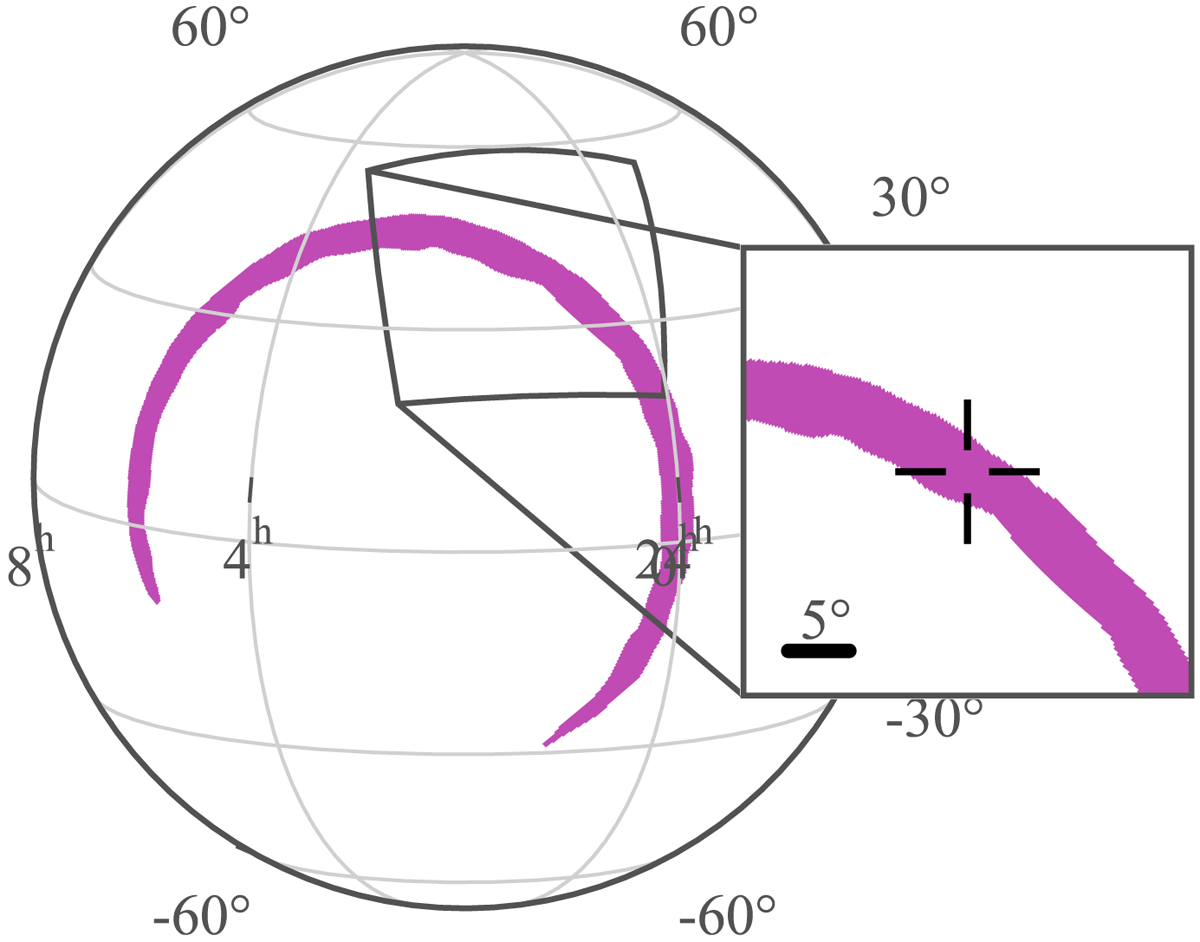
Download original image
Sky map of the two detector geometry when the detector is assumed to have an effective area that is proportional to the angle of the GRB w.r.t. its optical axis. Only the 1σ contour is shown for visual clarity.
Current usage metrics show cumulative count of Article Views (full-text article views including HTML views, PDF and ePub downloads, according to the available data) and Abstracts Views on Vision4Press platform.
Data correspond to usage on the plateform after 2015. The current usage metrics is available 48-96 hours after online publication and is updated daily on week days.
Initial download of the metrics may take a while.