Open Access
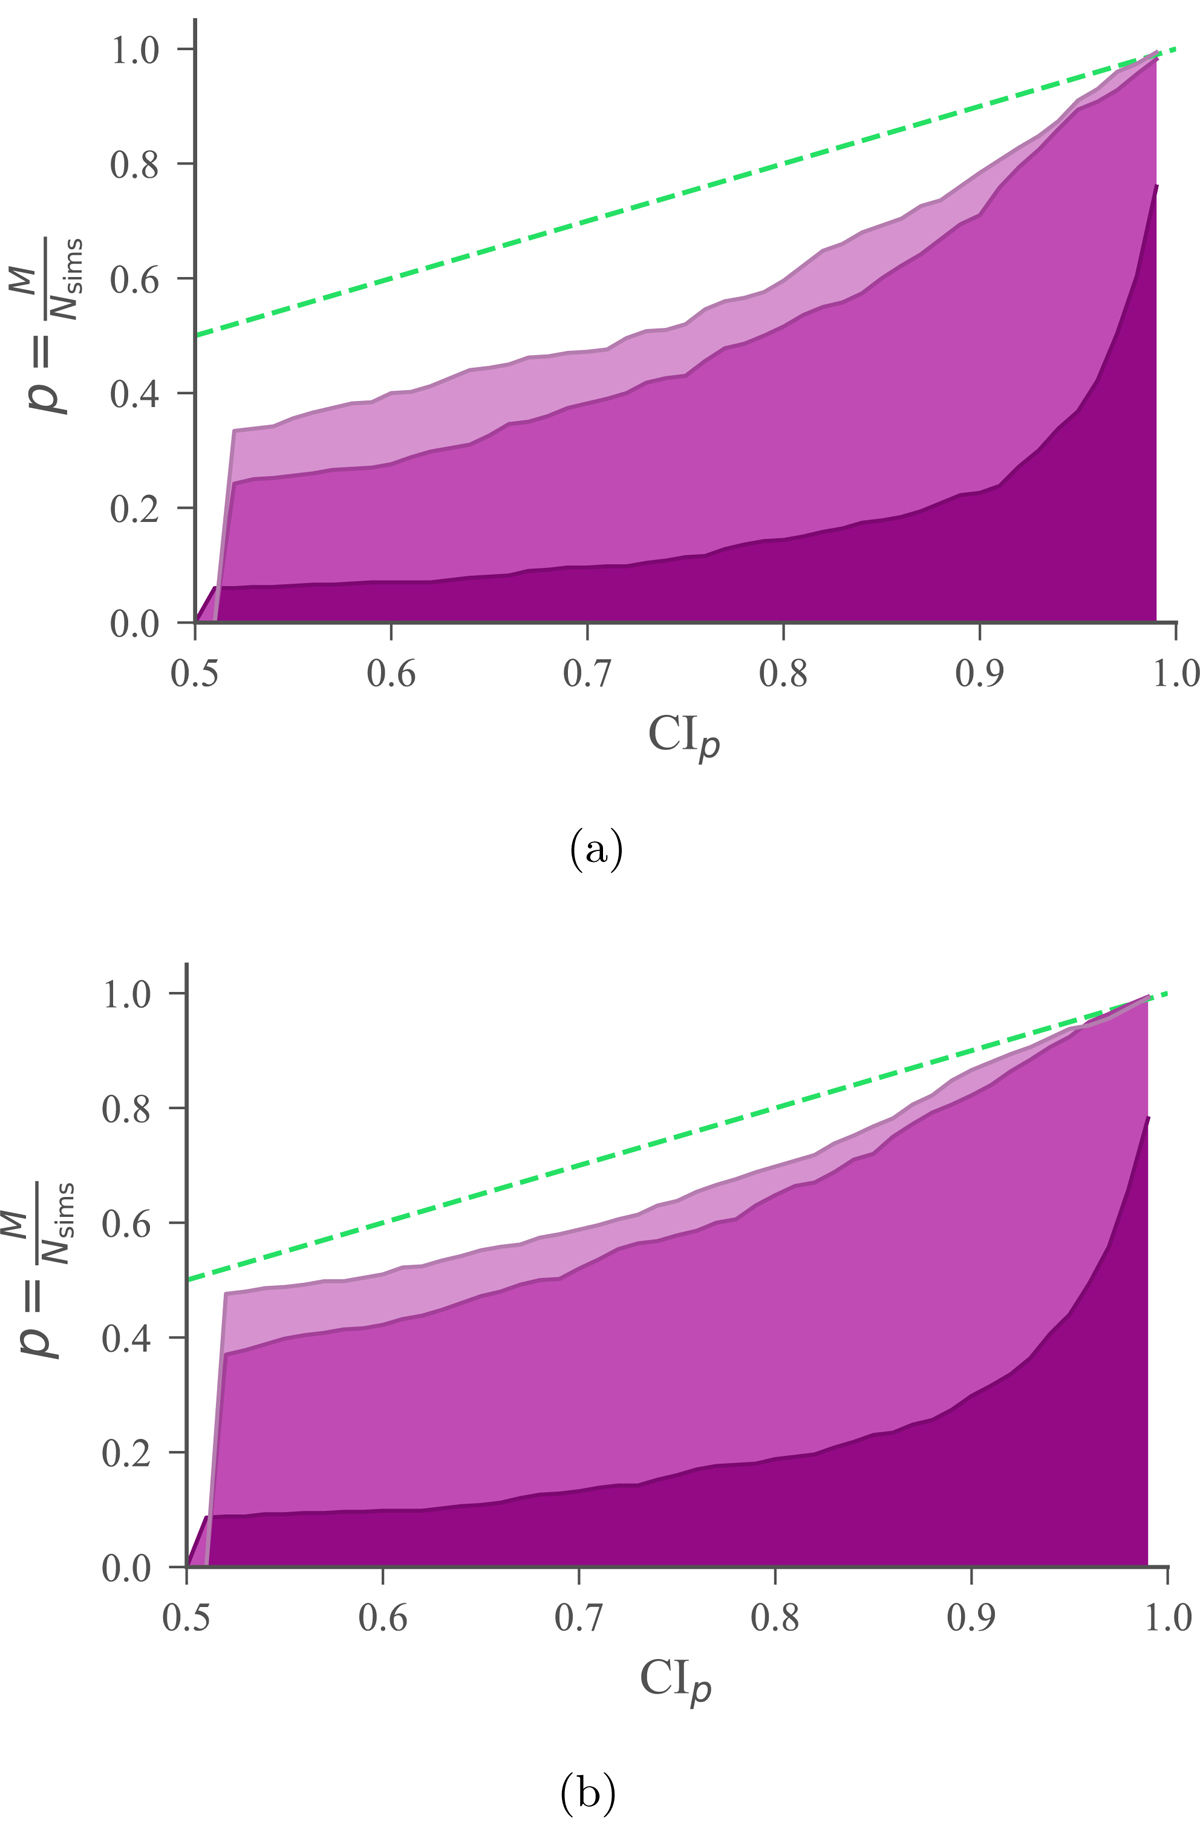
Fig. 26.
Download original image
Credible intervals of Δt versus the fraction of times the true, simulated value is within that credible intervals for each detector baseline. The green line represents a perfect, one-to-one relation. Here, coarser binnings are represented by lighter purple colors (topd1, 2 and bottomd1, 3).
Current usage metrics show cumulative count of Article Views (full-text article views including HTML views, PDF and ePub downloads, according to the available data) and Abstracts Views on Vision4Press platform.
Data correspond to usage on the plateform after 2015. The current usage metrics is available 48-96 hours after online publication and is updated daily on week days.
Initial download of the metrics may take a while.