Open Access
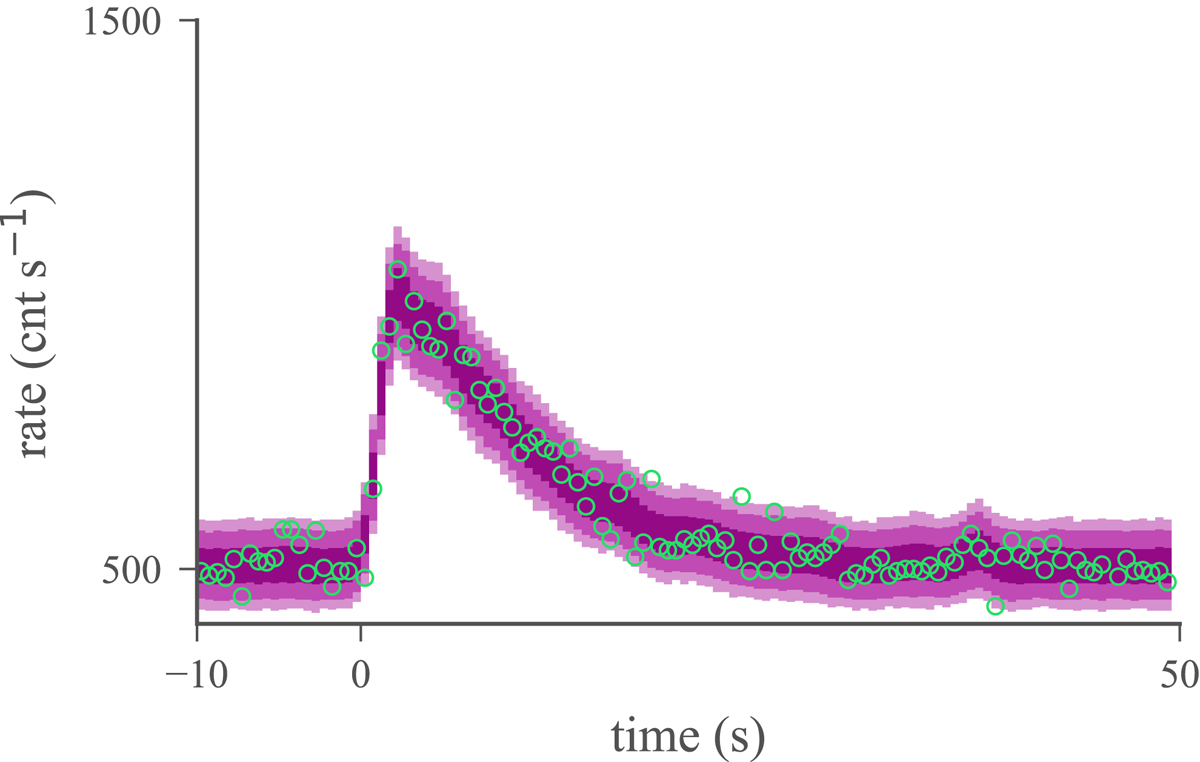
Fig. 22.
Download original image
Posterior predictive checks from fit in one of the detectors. The 1, 2 and 3σ regions are plotted in purple along with the data shown in green.
Current usage metrics show cumulative count of Article Views (full-text article views including HTML views, PDF and ePub downloads, according to the available data) and Abstracts Views on Vision4Press platform.
Data correspond to usage on the plateform after 2015. The current usage metrics is available 48-96 hours after online publication and is updated daily on week days.
Initial download of the metrics may take a while.