Open Access
Fig. 21.
Download original image
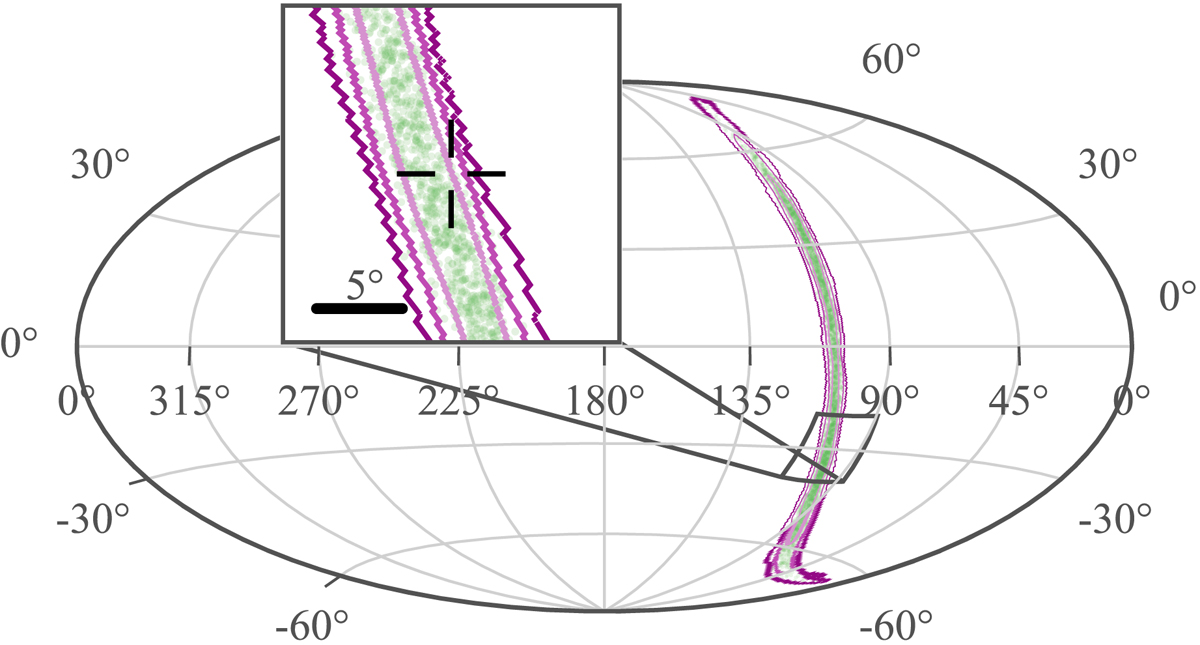
Skymap of the three detector validation. The purple contours indicate the 1, 2, and 3σ credible regions with increasing lightness. The posterior samples are shown in green and the simulated position is indicated by the cross-hairs.
Current usage metrics show cumulative count of Article Views (full-text article views including HTML views, PDF and ePub downloads, according to the available data) and Abstracts Views on Vision4Press platform.
Data correspond to usage on the plateform after 2015. The current usage metrics is available 48-96 hours after online publication and is updated daily on week days.
Initial download of the metrics may take a while.