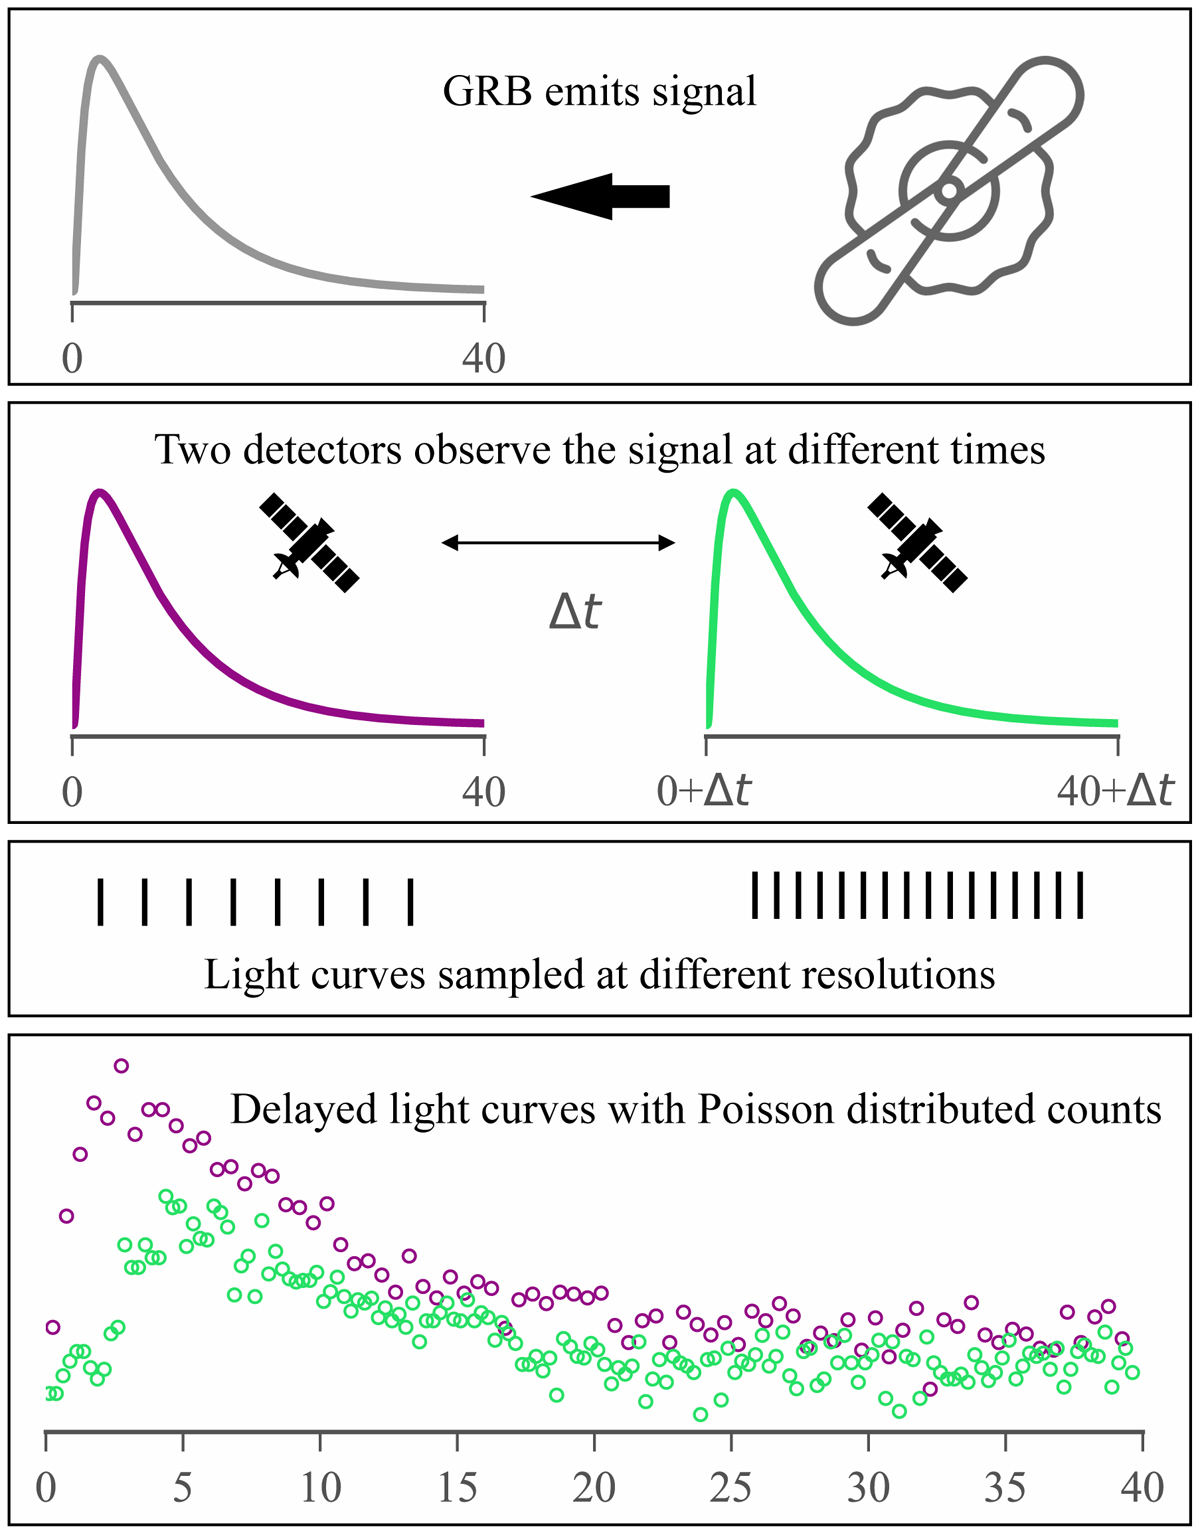
Fig. 2.
Download original image
Illustrative sketch of the problem as well as the framework for our forward model. A GRB emits a signal which is detected at two different times in detectors at different locations. These signals are translated into data sampled with different temporal resolutions and different detector effective areas resulting in two light curves which are delayed with respect to each other.
Current usage metrics show cumulative count of Article Views (full-text article views including HTML views, PDF and ePub downloads, according to the available data) and Abstracts Views on Vision4Press platform.
Data correspond to usage on the plateform after 2015. The current usage metrics is available 48-96 hours after online publication and is updated daily on week days.
Initial download of the metrics may take a while.