Open Access
Fig. 17.
Download original image
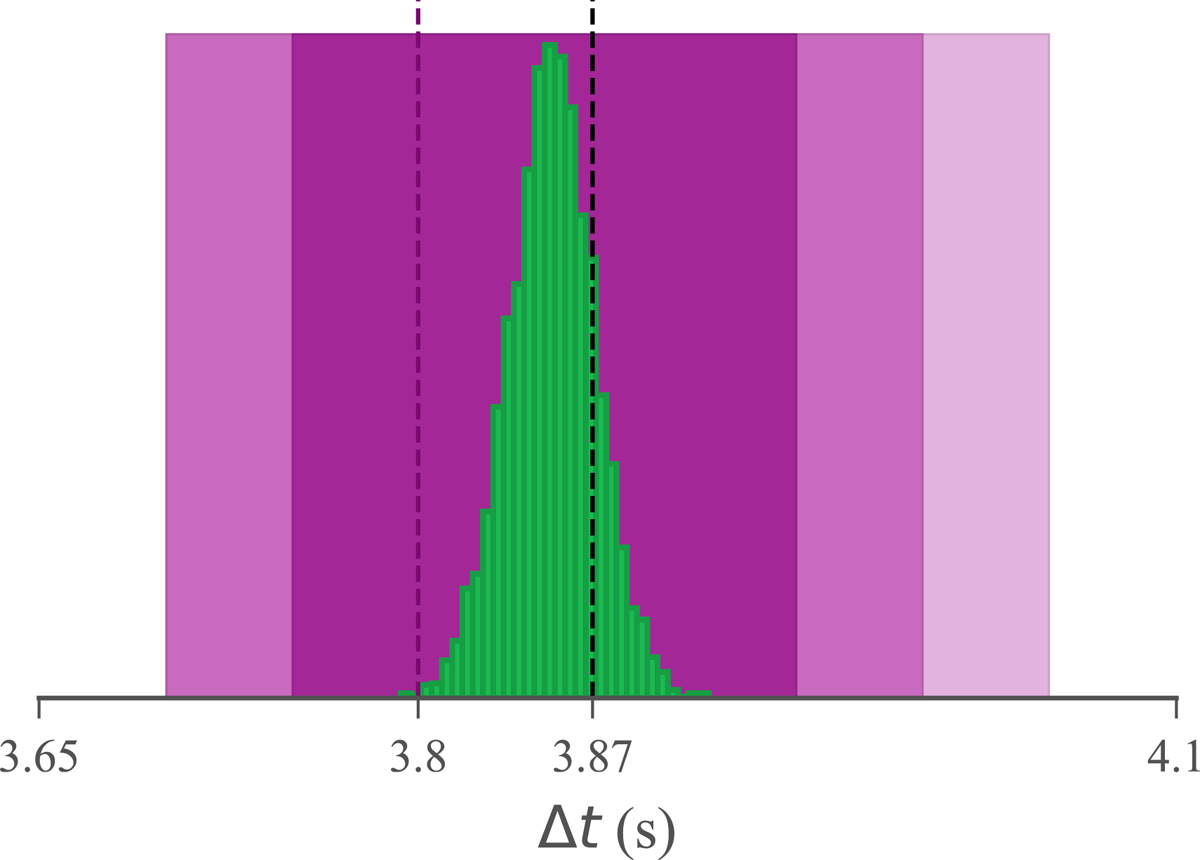
Marginal distribution of Δt from the nazgul fit (green) compared with the 1, 2 and 3σ confidence intervals (purple) from the cIPN method for two different resolutions. The coarse resolution used for the nazgul fit. The true value is shown as a black line and the mean value from the cIPN as a purple line.
Current usage metrics show cumulative count of Article Views (full-text article views including HTML views, PDF and ePub downloads, according to the available data) and Abstracts Views on Vision4Press platform.
Data correspond to usage on the plateform after 2015. The current usage metrics is available 48-96 hours after online publication and is updated daily on week days.
Initial download of the metrics may take a while.