Fig. 12.
Download original image
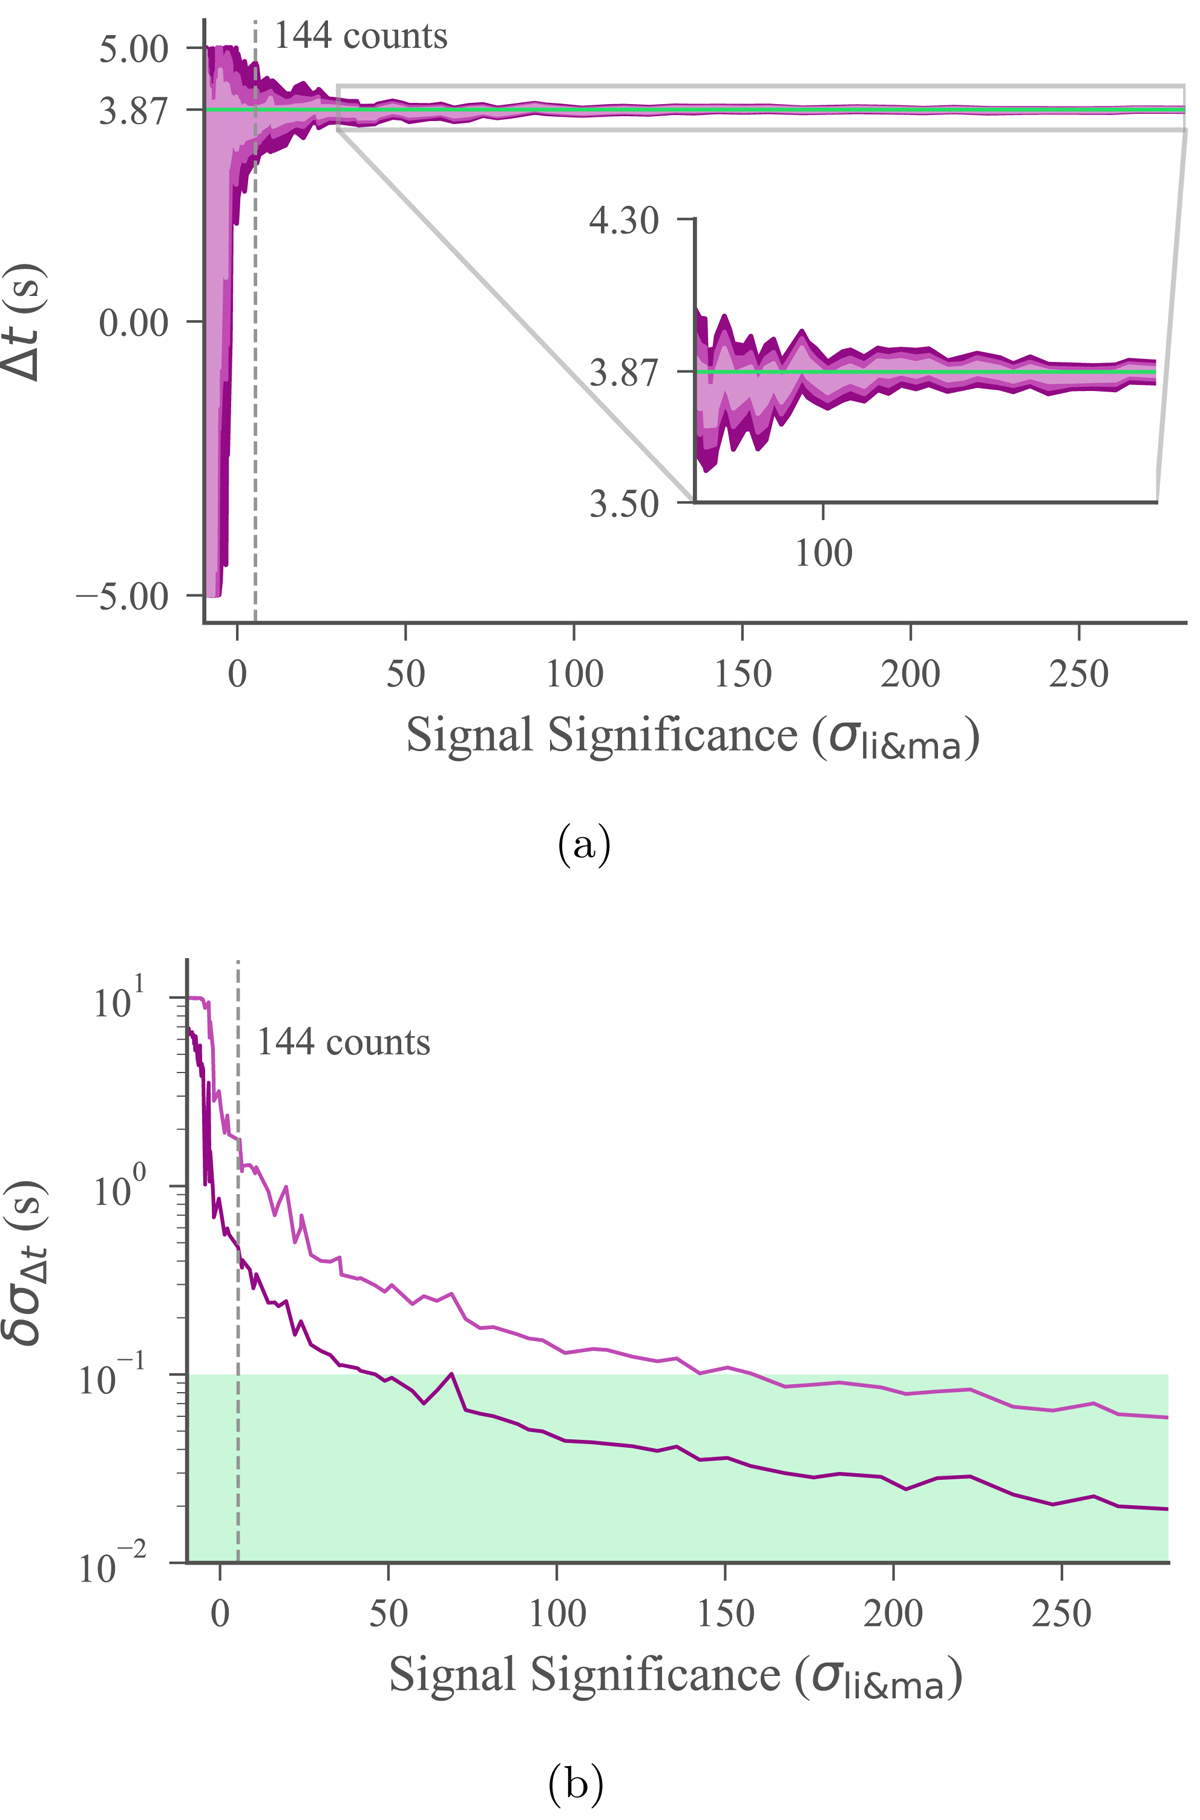
Panel a: 1, 2, and 3σ uncertainties (purple) of Δt as a function of significance compared with the simulated value (green). Panel b: width of the 1 and 2σ uncertainties for the nazgul and cIPN (purple and green respectively) as a function of significance. The green region is below the resolution of the data and the dashed line appears at ∼5σ where the number of background-subtracted counts in the peak are displayed.
Current usage metrics show cumulative count of Article Views (full-text article views including HTML views, PDF and ePub downloads, according to the available data) and Abstracts Views on Vision4Press platform.
Data correspond to usage on the plateform after 2015. The current usage metrics is available 48-96 hours after online publication and is updated daily on week days.
Initial download of the metrics may take a while.