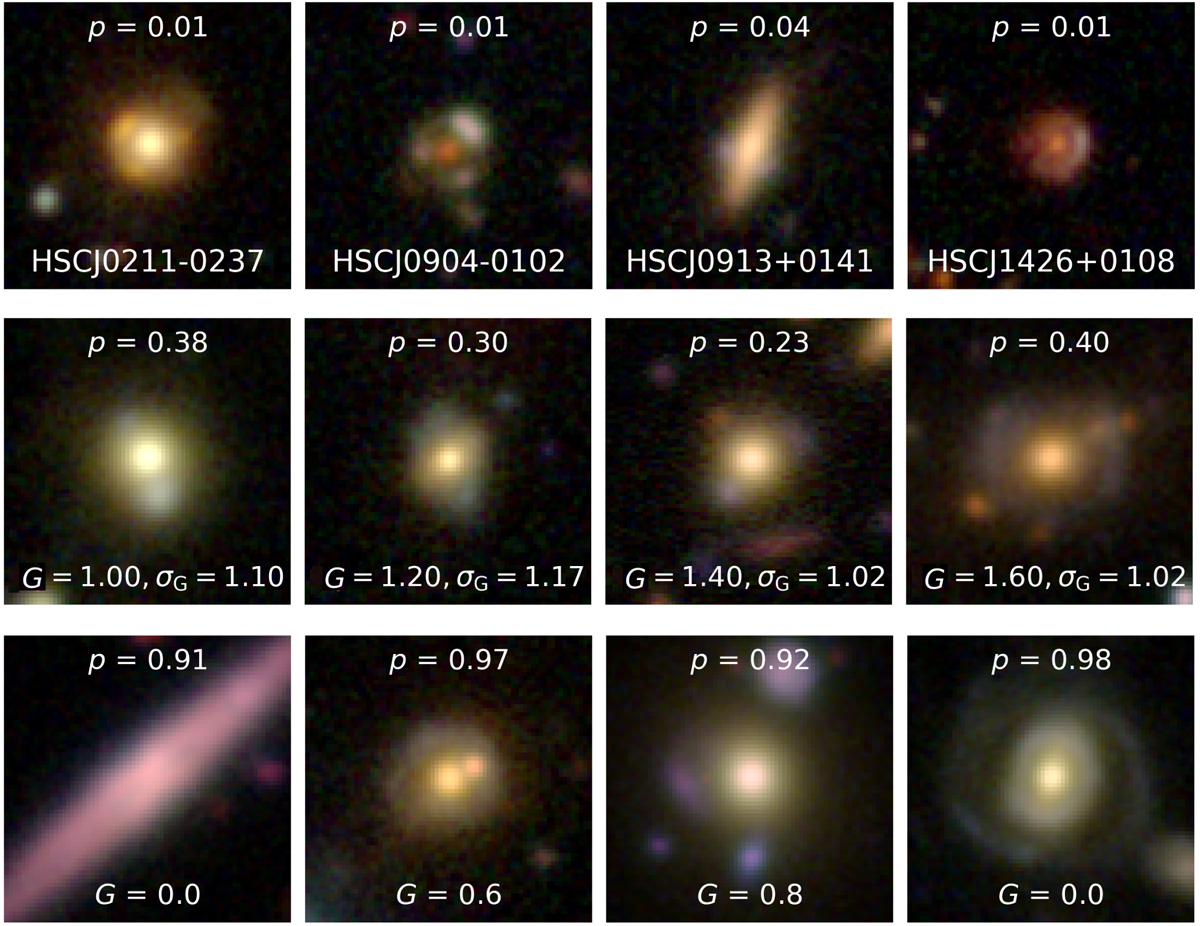
Fig. 3.
Download original image
Illustration of the network and visual classification stages. Top row: HSC three-color gri images of some SuGOHI galaxy-scale test lenses missed by the neural network, with scores p < 0.1. Second row: subset of ResNet candidates with elevated dispersion σG among our visual inspection grades. Third row: examples of interlopers with p > 0.1 and low average grades G, showing dust lanes or arc-like features around LRGs.
Current usage metrics show cumulative count of Article Views (full-text article views including HTML views, PDF and ePub downloads, according to the available data) and Abstracts Views on Vision4Press platform.
Data correspond to usage on the plateform after 2015. The current usage metrics is available 48-96 hours after online publication and is updated daily on week days.
Initial download of the metrics may take a while.