| Issue |
A&A
Volume 653, September 2021
|
|
|---|---|---|
| Article Number | A3 | |
| Number of page(s) | 11 | |
| Section | Stellar atmospheres | |
| DOI | https://doi.org/10.1051/0004-6361/202141442 | |
| Published online | 31 August 2021 | |
The first heavy-metal hot subdwarf composite binary SB 744
1
Astronomical Institute of the Czech Academy of Sciences,
25165
Ondřejov,
Czech Republic
2
Astroserver.org,
Fő tér 1,
8533
Malomsok,
Hungary
e-mail: peter.nemeth@astroserver.org
3
Institut für Physik und Astronomie, Universität Potsdam,
Karl-Liebknecht-Str. 24/25,
14476
Golm,
Germany
4
Laboratorio LCH, Centro de Investigación en Química Sostenible (CIQSO), Universidad de Huelva,
Huelva
21007,
Spain
Received:
31
May
2021
Accepted:
7
July
2021
Aims. The long-period sdOB+G1V type spectroscopic binary SB 744 reveals strong lines of fluorine and lead in the optical spectrum of the sdOB star and subsolar metallicity in the G1V companion thanks to a radial velocity follow-up study. Using high-quality observations and Gaia astrometric data, we aim to measure the chemical composition and Galactic kinematics of the system to put it into context with known populations of hot subdwarfs. Such binary systems have great potential to provide insights into the late stages of binary evolution as well as into the mysterious formation of stripped-core helium-burning stars.
Methods. We analyzed the optical spectra with homogeneous atmospheric models to derive the surface parameters of the binary members from a direct wavelength space decomposition. Then, we independently measured the atmospheric properties of the cool companion. The two independent methods achieved consistent results, which were amended with constraints from spectral energy distributions to provide a subdwarf mass. In addition, Gaia astrometry allowed us to derive the Galactic kinematics of the system.
Results. SB 744 turned out to be an old, Population II system that has gone through dramatic events. The hot subdwarf star belongs to the heavy-metal subclass of sdOB stars and we report super-solar abundances of lead, based on Pb III/IV lines. The He abundance of the hot subdwarf is the lowest among the known heavy-metal sdOB stars. The presence of fluorine implies that SB 744 was once a hierarchical triple system and the inner binary has merged in the near past. As an alternative scenario, single-star evolution through late core helium flash and atmospheric mixing can also produce the observed fluorine abundances. The atmospheric metal overabundances that are currently observed may perhaps be the result of a combination of mixing processes during formation and radiative support.
Key words: stars: abundances / stars: atmospheres / stars: individual: SB 744 / stars: chemically peculiar / binaries: spectroscopic / subdwarfs
© ESO 2021
1 Introduction
Hot subdwarf stars are 0.5 M⊙ core helium-burning stars on the extreme horizontal branch (EHB). Unlike normal horizontal branch stars, they retain only a very thin hydrogen envelope following their evolution on the red giant branch (RGB). The circumstances of the loss of the envelope are unclear, however it is assumed to take place by the time helium burning is ignited in the core. The precise timing and high binary fraction hints at an as yet unknown connection between mass loss and binary evolution (Heber 2009, 2016).
Binary population synthesis models have outlined three major channels for forming hot subdwarf stars: the Roche-lobe overflow (RLOF), the common-envelope (CE), and the binary white dwarf merger evolution. All three are related to binarity (Han et al. 2002). However, of the three channels, only the white dwarf merger channel predicts single hot subdwarfs (Zhang & Jeffery 2012b). As an alternative to binary evolution, single star evolution models with a delayed core He-flash can also produce hot subdwarfs and reproduce their observed properties (Miller Bertolami et al. 2008).
The spectral properties of hot subdwarfs show a nearly continuous sequence from 25 000 K B-type subdwarfs (sdB) to the hottest sdO type stars, exceeding 40 000 K. However, there are parallel sequences that are well separated by helium abundance, and, along these sequences, multiple groups can be identified (Edelmann et al. 2003; Németh et al. 2012). This granulation in the parameter space is correlated with other properties, such as binarity, and most likely indicates different formation pathways leading to different subclasses of hot subdwarfs. The spectra of the intermediate helium-rich subclass show a mix of He I and II lines (sdOB type) and their location in the parameter space differ from the canonical picture of sdB and sdO stars. A relation between sdB and sdO stars can be outlined by stellar evolution, where sdB stars are the progeny of post-EHB sdO stars. The similar binary properties of sdB and sdO types confirm this evolutionary link. However, the sdOB subclass shows a very low binary fraction, implying a different formation history. This hypothesis won further support when a set a studies, following Naslim et al. (2011), found heavy-metal over-abundances in several sdOB stars (Naslim et al. 2012, 2013; Jeffery et al. 2013, 2017). The trans-iron metal abundances reach over 10 000 times the solar values in these stars. Such heavy metals are produced by the s-process during the intermediate evolution within the He-shell burning environments of low-metallicity stars. However, whether these sdOB stars have extra amounts of heavy-metals or the observed abundances are the result of diffusion, which places metals selectively into a thin photospheric layer, is not yet clear.
Among the 11 heavy-metal subdwarfs currently cataloged (Naslim et al. 2020), two pulsators, LSIV-14°116 and Feige 46, have been identified (Dorsch et al. 2020). The two stars show strikingly similar temperature, gravity, and pulsation properties. Interestingly, two patterns seem to emerge: cooler and pulsating stars show Y, Zr, Sr overabundances, while hotter and non-pulsating heavy-metal subdwarfs show only a Pb enrichment (Fernández-Menchero et al. 2020; Naslim et al. 2020). The two different heavy-metal abundance patters are informally referred to as the Sr and Pb groups. The s-process produces Sr peak elements in high-metallicity stars and neutron capture can go all the way to Pb in low metallicity stars (Travaglio et al. 2004).
Detailed quantitative spectral analyses of double-lined composite spectrum binaries have been overlooked in past decades. In such systems, the precision is limited because we must fit two stars into a single spectrum and the orbital period is too long to apply Fourier disentangling methods (e.g., Hadrava 2009). Accuracy also suffers from large systematic shifts due to parameter correlations among the binary members. At the same time, subdwarf binary systems with main sequence companions are perfectly suitable for a direct, wavelength-space decomposition, as pioneered by Simon & Sturm (1994) thanks to the very different components. Using this method, Németh et al. (2012) were able to resolve 29 composite systems. Recent updates of the method enabled studies performing a more consistent disentangling and recover the radial velocities of the members (Reed et al. 2020).
Atomic diffusion is a complex process that is key to understanding stellar evolution on the horizontal branch and the horizontal branch morphology of globular clusters. The observed surface abundances depend on the conditions at formation (initial massand abundances after the giant branch) and the diffusive equilibrium abundances along the subsequent evolution (i.e., the age of the system). This requires a simultaneous optimization of multiple (time-dependent) model parameters, which is a complicated task for single stars. The binary nature of SB 744 and the presence of Pb and F in its atmosphere provide additional constraints and make the system very important to move the field forward.
SB 744 (also MCT 0146-2651) is a bright (V = 12.31 mag) hot subdwarf composite spectrum binary. It was first identified by Slettebak & Brundage (1971) as the 744th object in their catalog of early type stars near the south galactic pole. It is a relatively well-studied object, with its first quantitative spectral analyses dating back to the 1980s (Heber 1986; Unglaub & Bues 1989). Unglaub & Bues (1990) performed a detailed analysis by removing the contributions of the cool companion and derived Teff = 36 000 ± 3000 K, log g = 5.7 ± 0.3 cm s−2, and log(nHe∕nH) = −1.5 ± 0.2 for the sdOB primary. The physical binary nature of the system could not be confirmed by radial velocity measurements back then, but the low star density in the halo and the similarity to other composite hot subdwarf binaries has made it very likely that it is, in fact, a physical pair. Unglaub & Bues (1990) not only derived the atmospheric parameters correctly, but their estimated distance of 499 pc to the system is very close to the most recent measurements. The system has appeared in various surveys over the next two decades and was classified as an sdO7:He1+F/G type composite spectrum hot subdwarf (Lamontagne et al. 2000; Stark & Wade 2006), but, in general, dedicated studies avoided SB 744 for nearly 30 yrs. Vos et al. (2018a) started a systematic long-term radial velocity follow program for selected hot subdwarf composite spectrum binaries, among them with SB 744, to investigate their orbital period/mass ratio correlation. Vos et al. (2019a) found that the system has an orbit of P = 768 ± 11 d and they refined the classification of the secondary component to G1V. To improve the precision of radial velocity work we fitted the observations and computed synthetic spectra to be used as templates in the cross correlation. These templates revealed lines of lead and fluorine in the residuals of the composite fits (Vos et al. 2019c). This work reports that the sdOB star in SB 744 is a heavy-metal hot subdwarf star. The mere existence of this system raises the following questions: (1) if the F and Pb overabundances are caused by binary evolution, then we consider whether it works the same way in different evolution channels (e.g., RLOF, CE evolution) and (2) if the observed abundances are the result of pure atmospheric effects, then we consider whether all such sdOB stars with very similar atmospheric properties would be expected to show similar overabundances.
2 Spectroscopy
2.1 Observations
SB 744 is part of a long-term radial-velocity monitoring observing program on the Very Large Telescope (VLT) at the European Southern Observatory (ESO Program ID: 088.D-0364, 093.D-0629, and 0104.D-0135). It was observed with the Ultraviolet-Visible Echelle Spectrograph (UVES) 14 times between 2013 and 2020. The spectra cover the optical spectral range between 3750 and 9000 Å at a mean signal-to-noise ratio (S/N) of 50. The observations were performed in service mode and data reduction was done using standard procedures in EsoReflex (Freudling et al. 2013).
Ultraviolet spectra are also available in the MAST archive. Low-resolution spectra have been obtained by the International Ultraviolet Explorer (IUE) satellite with both the short and long wavelength apertures covering the ultraviolet between 1150 and 3200Å.
2.2 Analysis of the composite spectrum with XTGRID
The available observations of SB 744 do not sample the entire orbital period sufficiently, therefore, a wavelength space decomposition is more suitable for investigating the components. Then, a spectral decomposition of double-lined binaries require one to fit the linear combination of two synthetic spectra to the observations. This approach is able to overcome heavy line blending and is faster to implement. Such a procedure is available in the XTGRID (Németh et al. 2012) spectral analysis code. We updatedthe code to work with high-resolution data as well as to disentangle radial velocities and maintain a better consistency of the wavelength dependent flux contribution (dilution factor) of the components to the composite spectrum. We also amended the spectral analysis with a SED fitting procedure. In this approach, the surface parameters of the components are derived from the spectra, and the SED constraints are used only to improve the precision of the dilution factor.
The procedure applies TLUSTY/SYNSPEC non-Local Thermodynamic Equilibrium (non-LTE) model atmospheres (Hubeny & Lanz 2017; Lanz & Hubeny 2007) and corresponding synthetic spectra for the hot subdwarf. The spectral models include the first 30 elements of the periodic table and in addition: Ga, Ge, Sr, Y, Zr, Tc, Xe, and Pb. Important elements for the atmosphericstructure, such as H and He, C, N, O, Ne, Si, P, S, Fe, and Ni are included in non-LTE, while the remaining elements are calculated assuming LTE conditions in the spectral synthesis. Synthetic spectra for the cool companion are extracted from the BOSZ spectral library (Bohlin et al. 2017), which were calculated with the ATLAS9 (Kurucz 1979) code in LTE. To improve the internal consistency of our analysis we updated the decomposition procedure in XTGRID to force a more consistent flux contribution across the entire optical range. Recent updates in XTGRID allow to add new elements to the hot subdwarf model during runtime and fit spectra from different instruments together.
We started the fits using the atmospheric and binary parameters of SB 744 derived by Vos et al. (2018a). The spectral properties, the flux contributions and radial velocities of both stars were optimized simultaneously and iteratively to match the observation. XTGRID fits the effective temperature, surface gravity, and projected rotation velocity of both components. Abundances of the hot subdwarf were determined individually for each element and the scaled solar metallicity (where differences in [M/H] are analogous to differences in [Fe/H]), with alpha element enhancement corrections, were fitted for the cool companion. The microturbulent velocity is neglected for the subdwarf and included as a constant value (2 km s−1) in the synthetic spectra of the BOSZ library. We neglected macroturbulence in both components. XTGRID optimizes 38 parameters for the hot subdwarf, 6 parameters for the cool companion and, in addition, the dilution factor for the flux contributions. The dilution is updated iteratively along with the other free parameters following the steepest gradient of the global χ2 until the fit converges on the best solution.
Although the radial velocities of the components can be determined from the individual observations directly, the luminosities are not easy to estimate without knowing the precise radii and surface gravities. This can be improved when precise distances to the binaries are used, such as distances from the Gaia Data Release 2 or 3. However, in spite of the known distance to the system,  pc (Bailer-Jones et al. 2018), strong correlations between metallicity, flux contribution, and projected rotation are observed in the current data set. These correlations can be easily resolved for eclipsing binaries, where relative parameters can be measured; here, we could rely only on the relatively high S/N of the observations and the wide coverage across the optical spectral range, which includes several major spectral features from both components. The synthetic spectral templates resulting from the simultaneous modeling of the components were also used to increase the precision of radial velocity cross-correlation measurements of the hot subdwarf.
Parameter errors were calculated in two dimensions for Teff and log g to include their correlations. For abundances and binary parameters, the error calculations are done in one dimension, independently for the upper and lower error bars. Then the asymmetric errors are recalculated to symmetric ones. The low relative contributions of weak metal lines from the hot subdwarf to the composite spectrum make parameter determination more difficult from composite spectra and is reflected in the error bars.
Figure 1 shows selected regions of the best fit TLUSTY/XTGRID model to the UVES observations of SB 744. Figure 2 shows the SED fit, which was used to improve the dilution factor in the spectral decomposition. The broad coverage of the SED shows a remarkable consistency from the UV to the far infrared regions. The surface parameters of SB 744 are found in Table 1.
The orbital phase resolved observations allow to separate the lines of the components based on their relative Doppler shifts. This procedure also allows for spectral features that move with one of the components to be identified, even if the spectral models cannot reproduce them or they are below the noise level of a single observation.
The surface abundances of hot subdwarfs can be generally described by subsolar helium and light metal abundances, while iron is usually solar. In stars where trans-iron elements are detected, their abundances usually exceed the solar values by several orders of magnitude, which is most likely due to diffusion processes. Such an abundance pattern describes our findings well in SB 744, with three noteworthy exceptions:
First, while the light metal abundances are consistent with a tenth solar abundance, the iron abundance is low. This is consistent with the low metallicity of the companion and suggests that the binary formed in the metal-poor environment of an old population. In addition, we found strong lines of F in the spectrum of the subdwarf, corresponding to about 1000 times the solar F abundance. To our knowledge, this is the first detection of F in a hot subdwarf star. Finally, we found strong Pb III-IV lines that correspond to about 100 000 times the solar lead abundance, but we did not find similar, remarkably strong traces of other trans-iron elements.
The sdOB shows clear signs of a stratified atmosphere due to atomic diffusion: the wings of He lines are broad due to pressure broadening in deep layers and the central core absorption is shallow. This marks that He is mostly concentrated at the bottom of the atmosphere. Likewise, Pb lines that form near the photosphere are strong, while all expected strong lines that form higher in the atmosphere are absent. The strongest F lines are narrow in the observation, while a homogeneous model produce overly broad lines, indicating that most of F is likely concentrated above the photosphere and only the narrow line components are observed.
2.2.1 Fluorine
Fluorine is rare in optical stellar spectra. Bhowmick et al. (2020) investigated the presence of F in hot EHe stars. They found F in six out often stars and a level of overabundance that is about 1000 times solar, which is very similar to the value we found in SB 744. They found, based on trends of F with C, O, and Ne abundances that He burning after a white dwarf merger can account for the observed overabundances of fluorine. The helium white dwarf merger models of Zhang & Jeffery (2012a) also predict a F overabundance in EHe stars. Although hot subdwarfs are significantly less massive than EHe stars, products from similar nucelosynthesis processes can occur in their atmospheres. The main production site of F is the inter-shell region of asymptotic giant branch (AGB) stars and dredge-up can bring it to the surface. Werner et al. (2005) discovered F in extremely hot post-AGB stars. Similar conditions occur temporarily in hot subdwarfs that experience shell subflashes right after core He-ignition. Then, the 13C pockets produce F that may be mixed into the atmosphere (Lugaro et al. 2004).
Our line list holds 523 lines of F II with log(gf) > −2 in the observed UVES spectral range. The strongest optical lines of F II, expected at λ4103.51 Å and λ4246.72Å, are not observed. The observed three lines originate from the lowest energy level 2s2 2p3(4S°)3s (176 493.93 cm−1) among the optical transitions. The same lines have been observed by Bhowmick et al. (2020).
2.2.2 Lead
Lead is produced as the end product of the decay of heavier r-process elements and is also produced bythe s-process. Table 2 lists the three most widely used Pb IV lines (in bold font) that have been found in heavy-metal sdOB stars (Naslim et al. 2013). To extend this list and also include Pb III in the analysis, we took atomic energy levels from the NIST1 database and updated the line list with oscillator strengths of Pb III and Pb IV from Alonso-Medina et al. (2009) and Alonso-Medina et al. (2011), respectively. There is a notable systematic offset between the oscillator strengths by Naslim et al. (2013) and Alonso-Medina et al. (2011), while the relative oscillator strengths of the lines are consistent. This offset resulted in higher Pb abundances in our analysis. Naslim et al. (2013) found that the Pb IV λ3962.48 and Pb IV λ4049.80 lines are present in most stars while the Pb IV λ4496.15 line is often missing. We found the same behavior in SB 744, which is expected in stratified atmospheres. If the vertical element distribution is inhomogeneous and the strongest lines form near the photosphere, it may be shown that the lines are strong near the Balmer jump, as well as in the ultraviolet, but entirely missing in layers where the continuum forms outside the Pb rich layer. By identifying the lines, we can map the extent of the Pb enhanced layer. However, this requires a large set of relatively strong lines and multiple ionization stages. Such conditions are typically available in the atmospheres of cool stars and require high-quality ultraviolet and infrared observations.
Although our homogeneous models are able to simultaneously reproduce the relative strengths of Pb III and Pb IV lines, they are unable to ascertain that the derived Pb abundance reflects the true value. The uncertainty of atomic data and unknown stratification of Pb in the atmosphere limits the reliability of these results and requires further work. Microturbulence has similar effects on relative line strengths, such as extreme stratification. Jeffery & Miszalski (2019) explored a range of turbulent velocities, but microturbulence could not reproduce the observed line strength inconsistencies.
The simultaneous presence of F and Pb, along with the lack of other s-process elements in the atmosphere, provides an opportunity to investigate diffusion in SB 744. Either these elements are overproduced for some reason or diffusion is more efficient on these two elements and they sink much slower to subphotospheric layers. The Eddington luminosity fraction log(L∕LEdd) = −2.49 has a typical value for sdB stars, it is unlikely that SB 744 would have a stellar wind now. If the sdOB had a hotter and more extended stage in the past, the conditions were more favorable for a selective, opacity-driven wind, and provide radiative support to highly ionized (heavy-)metals.
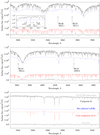 |
Fig. 1 Selected regions of the best-fit TLUSTY/XTGRID model of SB 744. Strong lines of F and Pb are marked and labelled in the figures. The decomposition over the entire VLT/UVES spectral range is available online at Astroserver (https://astroserver.org/TC43IV/). |
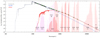 |
Fig. 2 TLUSTY/XTGRID spectral energy distribution. The green data points are taken from the VizieR photometric data service and used in the spectral decomposition to constrain the dilution factor. Over the GALEX FUV and NUV ranges, we show theobserved IUE spectra (black). The composite model (grey) is the sum of the TLUSTY sdOB (blue) and the ATLAS G1V(red) models. The shaded regions mark various filter pass-bands. |
2.3 Spectral analysis of the companion with GSSP
A spectroscopic analysis of the main sequence (MS) companion was performed using the Grid Search in a Stellar Parameters (GSSP) code (Tkachenko 2015). GSSP uses the method of atmosphere models and spectrum synthesis, comparing the observationswith each theoretical spectrum in the grid. For the calculation of synthetic spectra, the SynthV LTE-based radiative transfer code (Tsymbal 1996) and an interpolated grid of LTE Kurucz atmosphere models (Kurucz 1979) were used in this work.
GSSP optimizes seven stellar parameters at a time: effective temperature (Teff), surface gravity (log g), metallicity ([M/H]), micro-turbulent velocity (vmicro), macro-turbulent velocity (vmacro), projected rotational velocity (vr sini), and the dilution factor (FMS∕FTotal) of the MS star. A grid of theoretical spectra was built from all possible combinations of these parameters and GSSP compared them with respect to the observed normalized spectrum, using a χ2 merit function to match the synthetic spectra to the observations.
A master spectrum was obtained by shifting the UVES spectra of SB 744 to the rest velocity of the MS star. We used the wavelength interval of 5904–6518 Å and normalized the observations using a polynomial function fitted to hand picked continuum points. This red-ward range is a compromise between a high S/N and high contribution of the cool companion. Spectral regions (like 6270–6330 Å) containing telluric lines were avoided. The dilution factor was treated as a wavelength-independent factor for the short range in consideration here. Vos et al. (2018a) compared this approach with other spectral analysis methods and found that for short wavelength ranges, the fixed dilution factor does not reduce the accuracy.
The interpolated LTE Kurucz models extend the available metallicity range to [Fe/H] = −2.5 dex. The values of micro and macro-turbulent velocities were fixed in GSSP as the S/N of the master spectrum is not high enough to accurately determine these parameters. Their values, vmicro = 1.0 ± 0.2 km s−1 and vmacro = 2.9 ± 1.7 km s−1 were obtained using the calibrated relations of Bruntt et al. (2010) and Doyle et al. (2014), respectively.
The initial setup of the parameters search covers wide ranges with large step size in order to assure that the global minimum is found and prevents an excessive computational cost. From the analysis of this first coarse grid, a smaller step-size setup is arranged. The final parameter values and errors are obtained from this last performance by fitting a polynomial function to the reduced χ2 coefficients. The minimum defines the final parameter value and the cutting values at 1σ, provide the error intervals. The set of best-fit parameters summarized in Table 3 points to a G type star.
To obtain chemical abundances, some intervals along the master spectrum with characteristic lines of specific elements from bibliography were used. For abundances obtained from single lines, a previous study of the dilution factor is developed based on a larger wavelength range containing the studied line. Then, this value is held fixed in the line study. Abundances were obtained for the following elements: Na, Mg, Si, K, Ca, Sc, Ti, V, Cr, Mn, Fe, Co, Ni, Cu, Zn, Sr, Y, Zr, Ba, and Eu. No remarkable deviations are observed with respect to the global metallicity and the expected trends by Galactic chemical evolution.
CNO abundances in the MS star are key to understand binary interactions. The carbon abundance was derived using the single C I line at 8335.14 Å. The [C/Fe] abundance ratio is consistent with the Galactic C abundance trends observed in abundance studies (e.g. Mattsson 2010; Amarsi et al. 2019). We could not obtain a reliable nitrogen abundance from optical lines as the NI 8683.40 Å line is weak at low metallicity (Takeda & Honda 2005). The oxygen abundance determination was based on the strong O I triplet lines at 7771.94, 7774.17, and 7775.39 Å and OI lines at 8446 Å. The [O/Fe] is over the solar ratio, but consistent with the α-element enhancement predicted by Galactic chemical evolution and Galactic abundance trends observed in abundance studies (e.g., Bensby et al. 2014; Amarsi et al. 2019). The carbon and oxygen abundances are listed in Table 4.
Typical lines to derive lead abundances in MS stars are the two sensitive Pb I lines at 3683.46 and 4057.81 Å. The 3683 Å line is out from the range of the UVES BLUE arm spectrum, but the 4057.81 Å line can be used, however, it is often weak and blended. It was not visually detected in our spectrum, but we could derive an upper limit from it (Roederer et al. 2010). The upper limit on the Pb abundance is log nX∕nH = −10.39. Hence, we did not find any sign of Pb enhancement in the MS companion. In addition, our visual inspection of the entire master spectrum, looking for over-enhancement of the theoretical Pb lines from the NIST database had a negative result.
We did not find any suitable optical spectral lines for neutral or ionized fluorine in the main sequence star to obtain the fluorine abundance. Fluorine abundance determinations use vibrational lines in the near-IR (2.3 μm) from the HF molecule in relatively cool stars, which cannot be done with our spectra.
Spectroscopic surface and binary parameters from XTGRID.
Atomic data for Pb IV.
Atmospheric parameters determined with the GSSP code in the wavelength range 5904–6517 Å, excluding the 6270–6330 Å range.
C and O abundances of the G1V type companion in SB 744.
Photometry of SB 744 collected from Gaia, APASS, 2MASS, WISE, and Graham & Slettebak (1973).
3 Spectral energy distribution
An independent way to determine effective temperatures of both components is by using the photometric spectral energy distribution (SED) based on literature photometry. For SB 744 we used Stromgren photometry obtained at the Cerro Tololo observatory (Graham & Slettebak 1973), Gaia DR2 photometry (Gaia Collaboration 2018; Riello et al. 2018; Evans et al. 2018), APASS DR9 (Henden et al. 2015), 2MASS (Skrutskie et al. 2006) as well as WISE W1 and W2 (Cutri & et al. 2012). The photometry is summarized in Table 5. By using the Gaia parallax (Lindegren et al. 2018; Luri et al. 2018), also the radii of both components and their luminosity can be derived. We used the distance of  pc by Bailer-Jones et al. (2018), which is only slightly different than the distance obtained by simply inverting the Gaia parallax (489 ± 15 pc). The reddening in the direction of SB 744 as determined from the dust maps of Lallement et al. (2019) is E(B−V) = 0.01 ± 0.01, which is very low and will have little influence on the fit. The surface gravity cannot be constrained by an SED fit, and is kept fixed at the values determined from spectroscopy. The error on the surface gravity is propagated in the SED fit.
To fit the SED, models from the (Tübingen non-LTE Model-Atmosphere package (Werner et al. 2003) are used for the sdOB component and Kurucz atmosphere models (Kurucz 1979) for the companion. The fit uses a Markov chain Monte Carlo approach to find the global minimum and determine the error on the parameters. A more detailed description of the fitting process is given in Vos et al. (2013, 2017) and Vos et al. (2018a).
The SED fit results in Teff = 37 000 ± 1800 K and R = 0.15 ± 0.01 R⊙ for the sdOB component and Teff = 5800 ± 240 K and R = 0.93 ± 0.03 R⊙ for the cool companion. The total luminosity is 28.5 ± 2.2 L⊙ and 0.82 ± 0.05 L⊙ for the sdOB and companion, respectively. These results are in very good agreement with the parameters determined from spectroscopy. In Fig. 3, the photometry of SB 744 is shown together with the best-fit model and its decomposition into sdOB and MS components. The reduced χ2 value of the best fitting model is 4.1. This indicates that the errors on the photometry are likely to be a bit underestimated, which is a known problem in many photometric surveys. However, the O−C values of the SED fit are random and the good match between parameters determined from the spectroscopy as well as those from the photometry indicate that our spectroscopic parameters for SB 744 are reliable.
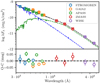 |
Fig. 3 SED of SB 744 together with the best-fit model. The observed fluxes are shown as open circles, while the calculated fluxes are shown as crosses. The best-fit binary model is shown as a black dashed line with the cool and hot component shown respectively by green and blue lines. |
4 Mass determination
Masses of the hot subdwarf and the cool companion can be determined using the surface gravity that is taken from the spectroscopic analysis, while the radius is drawn from the photometric SED. However, the surface gravity is difficult to determine in composite spectra (e.g., Németh et al. 2016; Vos et al. 2018a) because the blended lines cause a strong degeneracy between the components. An alternative to using the surface gravity and radius is to use stellar evolution models. The different effects at play in the atmospheres of hot subdwarfs that all affect the observed spectroscopic parameters make this method difficult for sdOB stars, but the cool companions are regular main sequence stars. They can have accreted some mass of the sdOB, but this is not more than a few percent of a solar mass and enough time has passed since the mass loss phase to allow the cool companion to settle again.
Here, we follow a similar approach as was used in Maxted et al. (2015) to determine the mass of the cool companion in SB 744. A Markov chain Monte-Carlo code is used to fit an evolution model to the effective temperature, radius, luminosity, and metallicity of the cool companion. The stellar evolution models used here are the MESA Isochrones and Stellar Tracks (MIST) models version 1.2 (Choi et al. 2016; Dotter 2016), which are calculated using MESA version r7503 (Paxton et al. 2011, 2013, 2015). This method is the same as used and tested on the DEBcat (Southworth 2015) eclipsing binaries catalog in Vos et al. (2018b).
Using this method, we find a mass of 0.72 ± 0.05 M⊙ for the cool companion. Using the mass ratio derived from the spectroscopic orbit (Vos et al. 2019a), the mass of the sdOB star is 0.47 ± 0.06 M⊙. This mass is very close to the canonical sdB mass of roughly 0.5 M⊙. The best-fitting track to the radius, luminosity and effective temperature of the cool companion is shown in Fig. 4. With the mass of the sdOB being almost exactly the same as the canonical mass, this sdOB is likely formed from a low-mass progenitor that ignited He under degenerate circumstances. While sdBs that form from higher-mass progenitors and ignite He in a non-degenerate core can have similar core masses, the majority of such systems have masses that are lower that those formed from low-mass progenitors (Han et al. 2002).
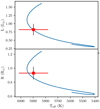 |
Fig. 4 Radius, luminosity, and effective temperature of the cool companion in SB 744 plotted in red, with the best-fitting MIST stellar track in blue. Only the main sequence part of the track is shown. This track fits the observed metallicity of the cool companion and has a mass of 0.72 M⊙. |
5 Galactic orbit
We used the GALPY software package (Bovy 2015) to calculate the kinematic properties and Galactic orbit of SB 744 in the Galactic potential. The important parameters here are the Galactic velocity components U, V, and W, as well as the orbital eccentricity, e, and the angular momentum component perpendicular to the Galactic plane Jz. The uncertainties were estimated via a Monte Carlo process. The calculated orbit in the Galactic X-Y plane can be seen in Fig. 5.
While the velocity components of SB 744, U = 21.28 ± 0.09 km s−1, V = 232.86 ± 0.07 km s−1, W = −38.97 ± 0.5 km s−1 are not enough on their own to distinguish it from a thin or thick disk star, the angular momentum and eccentricity of the Galactic orbit help to differentiate from the disk population. An average thin disk star has an eccentricity less than 0.3 and an angular momentum close to 1800 kpc km s−1, thick disk stars have an eccentricity below 0.75, and an angular momentum above 500 kpc km s−1 (Luo et al. 2020). SB 744 has a very high eccentricity of 0.89 ± 0.02 and very low angular momentum of 237 ± 55 kpc km s−1, placing it firmly in the Halo population. This is further supported by the low metallicity of the system of [Fe/H] = −1.02 ± 0.04 dex.
The few known heavy-metal hot subdwarfs show a kinematic pattern. While most of the He-rich sdOB stars belong to the thin disk (Martin et al. 2017), heavy-metal sdOB stars belong to the Halo population (Dorsch et al. 2020). We find SB 744 consistent with this general picture.
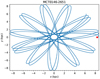 |
Fig. 5 Galactic orbit of SB 744 projected onto the Galactic plane. The trajectory over a time of 2 Gyr and the current position (red dot) is shown. |
6 Comparison with other long period sdB binaries
Currently, there are 25 long-period composite sdB binaries known with solved orbital parameters, of which 23 also have known mass ratios. For an overview of these systems, see Vos et al. (2019b) or Vos et al. (2020). In Fig. 6, the orbital period, mass ratio, and eccentricity of all long-period composite sdB binaries is plotted with SB 744 highlighted in red. These systems can be subdivided in two groups, the main group containing most systems, is shown in blue. The second group, which contains only a few systems, is shown in orange. Both groups show the same correlations of higher eccentricity at longer orbital period and lower mass ratio at wider orbits. However, the second group is found at shorter orbital periods. Vos et al. (2020) has found that the main group of systems can be formed from main sequence binaries with primary masses between 0.8 and 1.8 M⊙, with orbital periods varying between 100 and 900 days. The P-q correlation is explained by Galactic evolution.
When comparing the orbital parameters of SB 744 with the known composite sdB binaries, SB 744 falls in the main group of systems. There are no signs that this system is an outlier, neither based on the orbital characteristics, nor based on its mass. This would indicate that SB 744 is likely formed in the same way as the majority of long-period hot subdwarf binaries have formed.
7 Discussion and conclusions
The results support that a combination of mixing due to either binary evolution (merger) or single star evolution (dredge-up) and atomic diffusion are responsible for the observed F and Pb overabundances. Either a stellar merger or flash induced mixing brings core material to the surface, and diffusion supports highly ionized elements for longer periods of time. While atomic diffusion erases all metallicity based chemical history of the subdwarf older than a few million years, thanks to the composite nature of SB 744, the companion reveals the age and past interactions of the members, which put constraints on the viable formation channels. The stars we see with heavy metals are not likely to be exceptional and they do follow normal stellar evolution tracks, but we catch them in a particular phase when temporarily they are enriched in s-process elements.
While Pb has been observed in a dozen of sdOB stars, SB 744 is a first such star that shows a measurable F abundance. Fluorine is not often seen in optical spectra of stars, hence, its Galactic distribution is not well known. It is synthesized in three major sites: supernovae, inter-shell zones of AGB stars, and Wolf-Rayet stars. We associate the observed F abundance with He burning andatmospheric mixing. A strong bimodality of the F/Na ratio has been observed in globular clusters. This is consistent with stellar generations, where first generation stars are F-rich and Na-poor as well as second-generation stars are F-poor and Na-rich (de Laverny & Recio-Blanco 2013). This observation also suggest that SB 744 is an old system.
Vos et al. (2018a) have shown that distant companions accrete only a few per cent of a solar mass during the Roche-lobe overflow stage, not enough to significantly change their evolution time scales. Therefore, the age of the companion in SB 744 represents the age of the system at the accuracy of stellar evolution models. Assuming that SB 744 has a young subdwarf, this age also marks how much time the sdOB progenitor had to reach its current phase. The subdwarf phase is a relatively short period compared to the overall stellar evolution, which puts constraints on the initial mass of the subdwarf progenitor because the core mass depends on the initial mass, and the time spent on the RGB. Or, in case of a merger, a constraint can be given on the total mass of the components. The problem is that both binary star and triple star evolution can lead to the currently observed sdOB+MS binary.
It is not possible to uncover the history of the subdwarf in SB 744 from its current state and available data. Both single star evolution and binary merger models are able to explain the current observations. If a single star evolution is considered: it is possible that a low-mass (1–2 M⊙) star evolved through the RGB and experienced mass loss through Roche-lobe overflow. The mass loss interrupted further evolution on the RGB. The stripped He core of the subdwarf progenitor started its evolution on the white dwarf cooling sequence and experienced a delayed core He flash. Following the ignition of the He core, these stars experience a sequence of shell He-flashes, when the envelope material is mixed with new s-process elements from hot bottom burning. Finally, the star settles in its new equilibrium and slowly reaches its position corresponding to its core and envelope mass combination on the zero-age EHB. In the calm atmosphere of EHB stars, atomic diffusion is the major process that governs the observable abundance pattern. The spectral decomposition suggests that the companion is G1V type, a solar-like star, and the binary orbit shows its mass is 0.73 M⊙ corresponding to an early K type. This discrepancy is due to the low metallicity of the companion that increases the Teff corresponding to the same mass. Therefore, a Population II Halo MS star with 0.8 M⊙ appears to be an early G type star, similar to a 1 M⊙ Population I star (Gaia Collaboration 2018).
The binary star scenario starts with a hierarchical triple system with a more massive inner binary (0.8–2 M⊙). Depending on the initial masses, the inner binary may pass through one or two common-envelope stages. At the end of the common envelope evolution, the stars merge, ignite He core burning, and form a hot subdwarf. If the stars do not merge at the end of the common envelope stage, a close white dwarf binary remains, which loses orbital angular momentum and cannot avoid the final merger. The distant companion is not involved in the formation of the subdwarf. The binary merger channel also requires an efficient method to remove the angular momentum, as the subdwarf does not show a measurable projected rotation. The observed [M ∕H] = −1.0 and [α∕M] = 0.2 dex of the companion suggests that the system is likely older than 11 Gyr, which allows plenty of time to evolve through orbital decay and a merger.
The example of SB 744 shows that chemically homogeneous models are inappropriate for precision analyses of heavy-metal stars, yet it is important to provide first estimates. Although stratified atmosphere models, such as TLUSTY, are already available, the efficient fitting of such models to the observations is a demanding task just like the efforts undertaken to obtain the necessary high-quality observations.
The mass of the sdOB is fully consistent with EHB stars, but its location in the Teff − logg plane is not. This means that the star is either young and evolves towards the EHB or already passed the EHB and now is in a post-EHB He-shell burning stage. None of the post-EHB stars show any measurable heavy-metal abundances, therefore, we conclude that SB 744 must have a young sdOB star that has not yet reached the EHB. An alternative scenario would be if stars at the end of the EHB stage would experience a dredge up that mixes the envelope. The main points of our conclusion are as follows:
The sdOB in SB 744 has observed overabundances of Pb and F.
The observed He abundance of the sdOB star in SB 744 is the lowest among the known heavy-metal sdOB stars.
The companion does not show extra overabundances and looks like a normal low-metallicity MS star. The abundance pattern from the current data does not show past mass accretion from the sdOB progenitor. An [α/M] = 0.20 ± 0.05 dex alpha element enhancement is observed, which is consistent with Population II stars.
The mass of the sdOB is consistent with the canonical mass and is likely formed from a low-mass progenitor or a merger.
The Galactic orbit points that SB 744 is a Halo object, as has been the case with all other heavy-metal hot subdwarfs discovered to date.
SB 744 is a typical composite binary with orbital parameters similar to those of other composite subdwarf binaries. There is no reason to assume that its formation history was different from other composite hot subdwarfs.
The existence of the companion rejects the “companion explosion” formation channel and shows that the heavy-metal overabundances are not primordial or caused by an external source. They are, rather, pure atmospheric effects.
SB 744 demonstrates that heavy-metal overabundances occur in metal-poor stars, where efficient atomic diffusion can support the F and Pb abundance in thin photospheric layers.
The period of atmospheric overabundances are probably temporary, short lived phases compared to stellar evolution. This explains why not all similar stars exhibit heavy-metal overabundances, which are most likely in connection with mixing events following a He-shell subflash (Miller Bertolami et al. 2008). Therefore, we expect the number of stars with overabundances to be anticorrelated with the time that passed since the last subflash event.
The sdOB has a low iron abundance and an alpha element enhancement, which are in line with its assumed origin of low metallicity of Population II.
Our conclusion is that SB 744 is a unique system that shifts the investigations of heavy-metal subdwarfs to a new level and implies that more such subdwarfs may be hidden in composite spectrum binaries. Ultraviolet spectroscopic observations and stratified atmosphere models will be necessary for investigating the complete chemical profile of heavy-metal hot subdwarfs and reproduce their observed features.
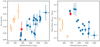 |
Fig. 6 Orbital period versus the eccentricity and mass ratio for all known composite sdB binaries with solved orbits. The main group is shown in blue filled circles, the secondary group in orange open circles, and SB 744 is highlighted as a red square. The orbital parameters of SB 744 fit with those of the main group. |
Acknowledgements
PN acknowledges support from the Grant Agency of the Czech Republic (GAČR 18-20083S). This work was supported by a fellowship for postdoctoral researchers from the Alexander von Humboldt Foundation awarded to JV. This research has used the services of www.Astroserver.org under reference TC43IV. This research has made use of the VizieR catalogue access tool, CDS, Strasbourg, France. Based on observations collected at the European Southern Observatory under ESO programmes 088.D-0364, 093.D-0629 and 0104.D-0135. This work has made use of data from the European Space Agency (ESA) mission Gaia (https://www.cosmos.esa.int/gaia), processed by the Gaia Data Processing and Analysis Consortium (DPAC, https://www.cosmos.esa.int/web/gaia/dpac/consortium). Funding for the DPAC has been provided by national institutions, in particular the institutions participating in the Gaia Multilateral Agreement.
Note added in proof: in parallel to our work Dorsch et al. (2021) have reported another composite binary system (EC 22536-5304) also harboring a heavy-metal sdOB star.
References
- Alonso-Medina, A., Colón, C., & Zanón, A. 2009, MNRAS, 395, 567 [NASA ADS] [CrossRef] [Google Scholar]
- Alonso-Medina, A., Colón, C., & Porcher, P. 2011, Atm. Data Nucl. Data Tables, 97, 36 [NASA ADS] [CrossRef] [Google Scholar]
- Amarsi, A. M., Nissen, P. E., & Skúladóttir, Á. 2019, A&A, 630, A104 [NASA ADS] [CrossRef] [EDP Sciences] [Google Scholar]
- Bailer-Jones, C. A. L., Rybizki, J., Fouesneau, M., Mantelet, G., & Andrae, R. 2018, AJ, 156, 58 [NASA ADS] [CrossRef] [Google Scholar]
- Bensby, T., Feltzing, S., & Oey, M. S. 2014, A&A, 562, A71 [NASA ADS] [CrossRef] [EDP Sciences] [Google Scholar]
- Bhowmick, A., Pandey, G., & Lambert, D. L. 2020, ApJ, 891, 40 [NASA ADS] [CrossRef] [Google Scholar]
- Bohlin, R. C., Mészáros, S., Fleming, S. W., et al. 2017, AJ, 153, 234 [NASA ADS] [CrossRef] [Google Scholar]
- Bovy, J. 2015, ApJS, 216, 29 [Google Scholar]
- Bruntt, H., Bedding, T. R., Quirion, P. O., et al. 2010, MNRAS, 405, 1907 [Google Scholar]
- Choi, J., Dotter, A., Conroy, C., et al. 2016, ApJ, 823, 102 [Google Scholar]
- Cutri, R. M., et al. 2012, VizieR Online Data Catalog: 2311 [Google Scholar]
- de Laverny, P., & Recio-Blanco, A. 2013, A&A, 555, A121 [NASA ADS] [CrossRef] [EDP Sciences] [Google Scholar]
- Dorsch, M., Latour, M., Heber, U., et al. 2020, A&A, 643, A22 [EDP Sciences] [Google Scholar]
- Dorsch, M., Jeffery, C. S., Irrgang, A., Woolf, V., & Heber, U. 2021, A&A, in press, https://doi.org/10.1051/0004-6361/202141381 [NASA ADS] [CrossRef] [EDP Sciences] [Google Scholar]
- Dotter, A. 2016, ApJS, 222, 8 [NASA ADS] [CrossRef] [Google Scholar]
- Doyle, A. P., Davies, G. R., Smalley, B., Chaplin, W. J., & Elsworth, Y. 2014, MNRAS, 444, 3592 [Google Scholar]
- Edelmann, H., Heber, U., Hagen, H. J., et al. 2003, A&A, 400, 939 [NASA ADS] [CrossRef] [EDP Sciences] [Google Scholar]
- Evans, D. W., Riello, M., De Angeli, F., et al. 2018, A&A, 616, A4 [NASA ADS] [CrossRef] [EDP Sciences] [Google Scholar]
- Fernández-Menchero, L., Jeffery, C. S., Ramsbottom, C. A., & Ballance, C. P. 2020, MNRAS, 496, 2558 [CrossRef] [Google Scholar]
- Freudling, W., Romaniello, M., Bramich, D. M., et al. 2013, A&A, 559, A96 [NASA ADS] [CrossRef] [EDP Sciences] [Google Scholar]
- Gaia Collaboration (Brown, A. G. A., et al.) 2018, A&A, 616, A1 [NASA ADS] [CrossRef] [EDP Sciences] [Google Scholar]
- Graham, J. A., & Slettebak, A. 1973, AJ, 78, 295 [NASA ADS] [CrossRef] [Google Scholar]
- Hadrava, P. 2009, ArXiv e-prints [arXiv:0909.0172] [Google Scholar]
- Han, Z., Podsiadlowski, P., Maxted, P. F. L., Marsh, T. R., & Ivanova, N. 2002, ASP Conf. Ser., 279, 285 [Google Scholar]
- Heber, U. 1986, A&A, 155, 33 [NASA ADS] [Google Scholar]
- Heber, U. 2009, ARA&A, 47, 211 [Google Scholar]
- Heber, U. 2016, PASP, 128, 082001 [NASA ADS] [CrossRef] [Google Scholar]
- Henden, A. A., Levine, S., Terrell, D., & Welch, D. L. 2015, AAS Meeting Abs., 225, 336.16 [Google Scholar]
- Hubeny, I., & Lanz, T. 2017, ArXiv e-prints [arXiv:1706.01859] [Google Scholar]
- Jeffery, C. S., & Miszalski, B. 2019, MNRAS, 489, 1481 [Google Scholar]
- Jeffery, C. S., Ramsay, G., Naslim, N., et al. 2013, MNRAS, 429, 3207 [NASA ADS] [CrossRef] [Google Scholar]
- Jeffery, C. S., Baran, A. S., Behara, N. T., et al. 2017, MNRAS, 465, 3101 [NASA ADS] [CrossRef] [Google Scholar]
- Kurucz, R. L. 1979, ApJS, 40, 1 [NASA ADS] [CrossRef] [Google Scholar]
- Lallement, R., Babusiaux, C., Vergely, J. L., et al. 2019, A&A, 625, A135 [NASA ADS] [CrossRef] [EDP Sciences] [Google Scholar]
- Lamontagne, R., Demers, S., Wesemael, F., Fontaine, G., & Irwin, M. J. 2000, AJ, 119, 241 [Google Scholar]
- Lanz, T., & Hubeny, I. 2007, ApJS, 169, 83 [Google Scholar]
- Lindegren, L., Hernández, J., Bombrun, A., et al. 2018, A&A, 616, A2 [NASA ADS] [CrossRef] [EDP Sciences] [Google Scholar]
- Lugaro, M., Ugalde, C., Karakas, A. I., et al. 2004, ApJ, 615, 934 [NASA ADS] [CrossRef] [Google Scholar]
- Luo, Y., Németh, P., & Li, Q. 2020, ApJ, 898, 64 [Google Scholar]
- Luri, X., Brown, A. G. A., Sarro, L. M., et al. 2018, A&A, 616, A9 [NASA ADS] [CrossRef] [EDP Sciences] [Google Scholar]
- Martin, P., Jeffery, C. S., Naslim, N., & Woolf, V. M. 2017, MNRAS, 467, 68 [NASA ADS] [Google Scholar]
- Mattsson, L. 2010, A&A, 515, A68 [NASA ADS] [CrossRef] [EDP Sciences] [Google Scholar]
- Maxted, P. F. L., Serenelli, A. M., & Southworth, J. 2015, A&A, 575, A36 [NASA ADS] [CrossRef] [EDP Sciences] [Google Scholar]
- Miller Bertolami, M. M., Althaus, L. G., Unglaub, K., & Weiss, A. 2008, A&A, 491, 253 [NASA ADS] [CrossRef] [EDP Sciences] [Google Scholar]
- Naslim, N., Jeffery, C. S., Behara, N. T., & Hibbert, A. 2011, MNRAS, 412, 363 [NASA ADS] [CrossRef] [Google Scholar]
- Naslim, N., Geier, S., Jeffery, C. S., et al. 2012, MNRAS, 423, 3031 [NASA ADS] [CrossRef] [Google Scholar]
- Naslim, N., Jeffery, C. S., Hibbert, A., & Behara, N. T. 2013, MNRAS, 434, 1920 [NASA ADS] [CrossRef] [Google Scholar]
- Naslim, N., Jeffery, C. S., & Woolf, V. M. 2020, MNRAS, 491, 874 [Google Scholar]
- Németh, P., Kawka, A., & Vennes, S. 2012, MNRAS, 427, 2180 [Google Scholar]
- Németh, P., Ziegerer, E., Irrgang, A., et al. 2016, ApJ, 821, L13 [NASA ADS] [CrossRef] [Google Scholar]
- Paxton, B., Bildsten, L., Dotter, A., et al. 2011, ApJS, 192, 3 [Google Scholar]
- Paxton, B., Cantiello, M., Arras, P., et al. 2013, ApJS, 208, 4 [NASA ADS] [CrossRef] [Google Scholar]
- Paxton, B., Marchant, P., Schwab, J., et al. 2015, ApJS, 220, 15 [Google Scholar]
- Reed, M. D., Shoaf, K. A., Németh, P., et al. 2020, MNRAS, 493, 5162 [Google Scholar]
- Riello, M., De Angeli, F., Evans, D. W., et al. 2018, A&A, 616, A3 [NASA ADS] [CrossRef] [EDP Sciences] [Google Scholar]
- Roederer, I. U., Cowan, J. J., Karakas, A. I., et al. 2010, ApJ, 724, 975 [NASA ADS] [CrossRef] [Google Scholar]
- Simon, K. P., & Sturm, E. 1994, A&A, 281, 286 [NASA ADS] [Google Scholar]
- Skrutskie, M. F., Cutri, R. M., Stiening, R., et al. 2006, AJ, 131, 1163 [NASA ADS] [CrossRef] [Google Scholar]
- Slettebak, A., & Brundage, R. K. 1971, AJ, 76, 338 [NASA ADS] [CrossRef] [Google Scholar]
- Southworth, J. 2015, ASPCS, 496, 164 [NASA ADS] [Google Scholar]
- Stark, M. A., & Wade, R. A. 2006, Balt. Astron., 15, 175 [NASA ADS] [Google Scholar]
- Takeda, Y., & Honda, S. 2005, PASJ, 57, 65 [NASA ADS] [Google Scholar]
- Tkachenko, A. 2015, A&A, 581, A129 [NASA ADS] [CrossRef] [EDP Sciences] [Google Scholar]
- Travaglio, C., Gallino, R., Arnone, E., et al. 2004, ApJ, 601, 864 [NASA ADS] [CrossRef] [Google Scholar]
- Tsymbal, V. 1996, ASP Conf. Ser., 108, 198 [Google Scholar]
- Unglaub, K., & Bues, I. 1989, Astronomische Gesellschaft Abstract Series, 3, 55 [NASA ADS] [Google Scholar]
- Unglaub, K., & Bues, I. 1990, A&A, 233, 159 [NASA ADS] [Google Scholar]
- Vos, J., Østensen, R. H., Németh, P., et al. 2013, A&A, 559, A54 [NASA ADS] [CrossRef] [EDP Sciences] [Google Scholar]
- Vos, J., Østensen, R. H., Vučković, M., & Van Winckel, H. 2017, A&A, 605, A109 [NASA ADS] [CrossRef] [EDP Sciences] [Google Scholar]
- Vos, J., Németh, P., Vučković, M., Østensen, R., & Parsons, S. 2018a, MNRAS, 473, 693 [NASA ADS] [CrossRef] [Google Scholar]
- Vos, J., Zorotovic, M., Vučković, M., Schreiber, M. R., & Østensen, R. 2018b, MNRAS, 477, L40 [NASA ADS] [CrossRef] [Google Scholar]
- Vos, J., Vučković, M., Chen, X., et al. 2019a, MNRAS, 482, 4592 [NASA ADS] [CrossRef] [Google Scholar]
- Vos, J., Vučković, M., Chen, X., et al. 2019b, Contrib. Astron. Observ. Skal. Pleso, 49, 264 [NASA ADS] [Google Scholar]
- Vos, J., Nemeth, P., Molina, F., Bastian, A., & Barlow, B. 2019c, The heavy metal sdB+MS halo binary MCT 0146-2651 [Google Scholar]
- Vos, J., Bobrick, A., & Vučković, M. 2020, A&A, 641, A163 [CrossRef] [EDP Sciences] [Google Scholar]
- Werner, K., Deetjen, J. L., Dreizler, S., et al. 2003, ASPCS, 288, 31 [Google Scholar]
- Werner, K., Rauch, T., & Kruk, J. W. 2005, A&A, 433, 641 [NASA ADS] [CrossRef] [EDP Sciences] [Google Scholar]
- Zhang, X., & Jeffery, C. S. 2012a, MNRAS, 426, L81 [NASA ADS] [CrossRef] [Google Scholar]
- Zhang, X., & Jeffery, C. S. 2012b, MNRAS, 419, 452 [NASA ADS] [CrossRef] [Google Scholar]
All Tables
Atmospheric parameters determined with the GSSP code in the wavelength range 5904–6517 Å, excluding the 6270–6330 Å range.
Photometry of SB 744 collected from Gaia, APASS, 2MASS, WISE, and Graham & Slettebak (1973).
All Figures
|
Fig. 1 Selected regions of the best-fit TLUSTY/XTGRID model of SB 744. Strong lines of F and Pb are marked and labelled in the figures. The decomposition over the entire VLT/UVES spectral range is available online at Astroserver (https://astroserver.org/TC43IV/). |
| In the text | |
|
Fig. 2 TLUSTY/XTGRID spectral energy distribution. The green data points are taken from the VizieR photometric data service and used in the spectral decomposition to constrain the dilution factor. Over the GALEX FUV and NUV ranges, we show theobserved IUE spectra (black). The composite model (grey) is the sum of the TLUSTY sdOB (blue) and the ATLAS G1V(red) models. The shaded regions mark various filter pass-bands. |
| In the text | |
|
Fig. 3 SED of SB 744 together with the best-fit model. The observed fluxes are shown as open circles, while the calculated fluxes are shown as crosses. The best-fit binary model is shown as a black dashed line with the cool and hot component shown respectively by green and blue lines. |
| In the text | |
|
Fig. 4 Radius, luminosity, and effective temperature of the cool companion in SB 744 plotted in red, with the best-fitting MIST stellar track in blue. Only the main sequence part of the track is shown. This track fits the observed metallicity of the cool companion and has a mass of 0.72 M⊙. |
| In the text | |
|
Fig. 5 Galactic orbit of SB 744 projected onto the Galactic plane. The trajectory over a time of 2 Gyr and the current position (red dot) is shown. |
| In the text | |
|
Fig. 6 Orbital period versus the eccentricity and mass ratio for all known composite sdB binaries with solved orbits. The main group is shown in blue filled circles, the secondary group in orange open circles, and SB 744 is highlighted as a red square. The orbital parameters of SB 744 fit with those of the main group. |
| In the text | |
Current usage metrics show cumulative count of Article Views (full-text article views including HTML views, PDF and ePub downloads, according to the available data) and Abstracts Views on Vision4Press platform.
Data correspond to usage on the plateform after 2015. The current usage metrics is available 48-96 hours after online publication and is updated daily on week days.
Initial download of the metrics may take a while.