Fig. 2
Download original image
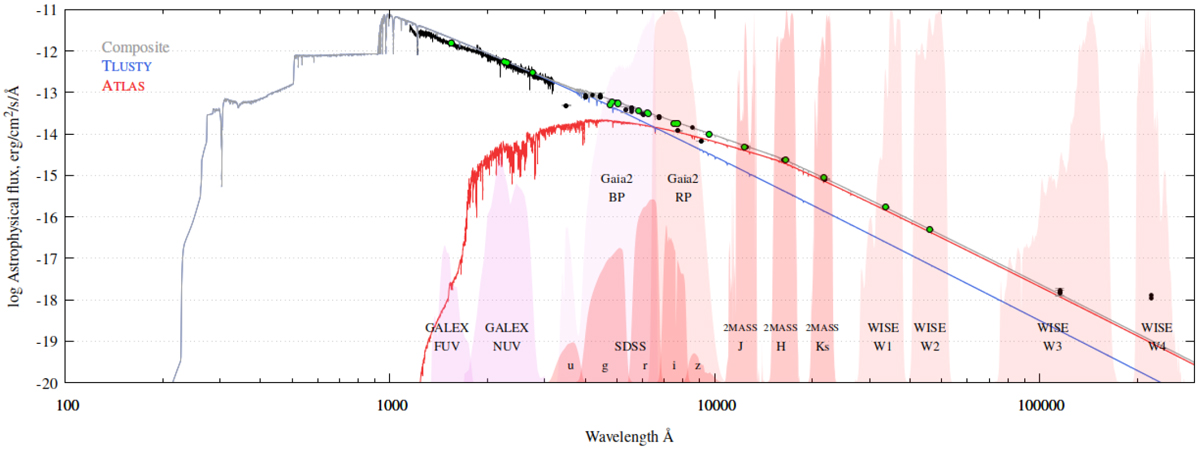
TLUSTY/XTGRID spectral energy distribution. The green data points are taken from the VizieR photometric data service and used in the spectral decomposition to constrain the dilution factor. Over the GALEX FUV and NUV ranges, we show theobserved IUE spectra (black). The composite model (grey) is the sum of the TLUSTY sdOB (blue) and the ATLAS G1V(red) models. The shaded regions mark various filter pass-bands.
Current usage metrics show cumulative count of Article Views (full-text article views including HTML views, PDF and ePub downloads, according to the available data) and Abstracts Views on Vision4Press platform.
Data correspond to usage on the plateform after 2015. The current usage metrics is available 48-96 hours after online publication and is updated daily on week days.
Initial download of the metrics may take a while.