Fig. 9.
Download original image
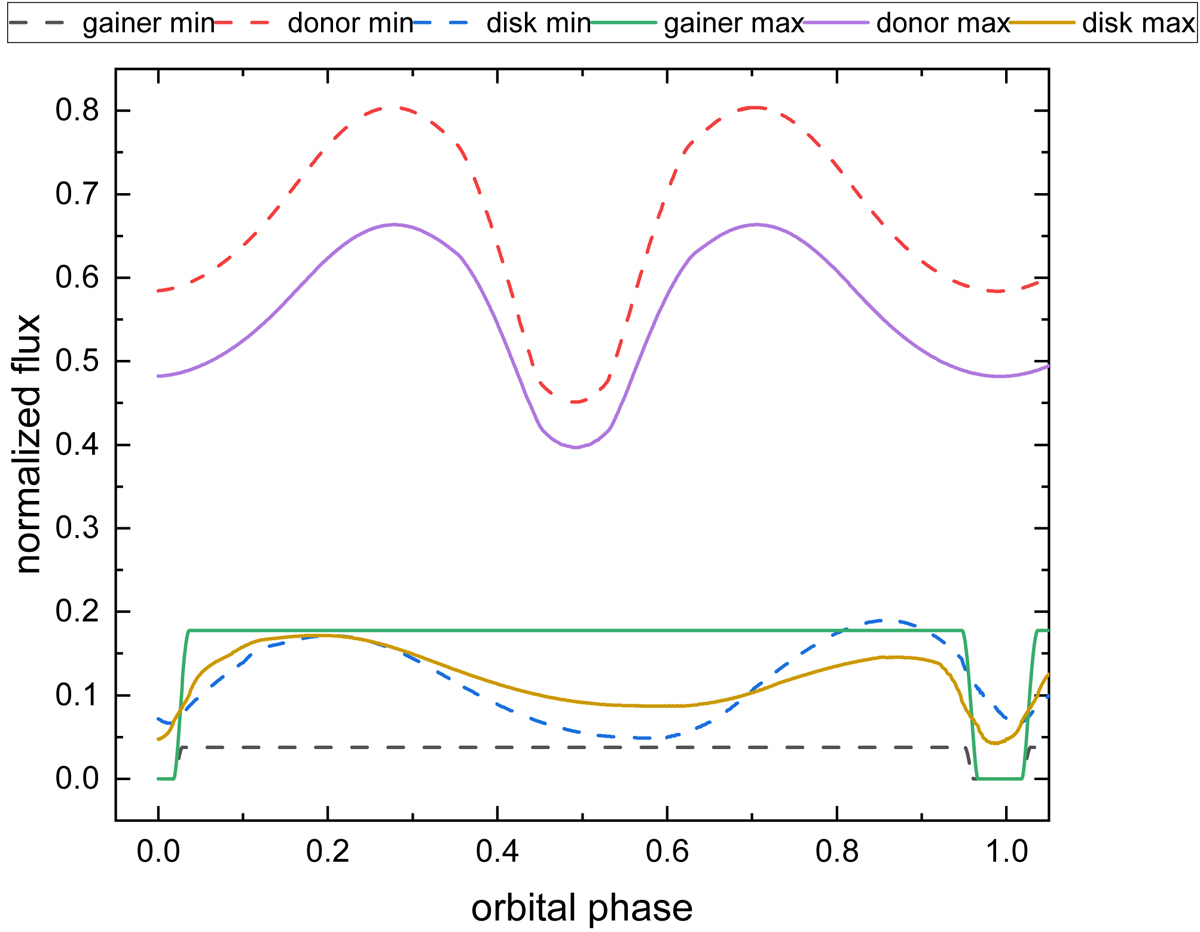
Fluxes at the I-band of gainer, donor and disk per orbital phase, normalized to the total flux at every orbital phase. Data at the two epochs for the minimum (dashed lines) and maximum (solid lines) of the long cycle reported by Mennickent et al. (2020a) are given. These data are the datasets labeled 11 and 44, respectively, in Table A.1.
Current usage metrics show cumulative count of Article Views (full-text article views including HTML views, PDF and ePub downloads, according to the available data) and Abstracts Views on Vision4Press platform.
Data correspond to usage on the plateform after 2015. The current usage metrics is available 48-96 hours after online publication and is updated daily on week days.
Initial download of the metrics may take a while.