Fig. 3.
Download original image
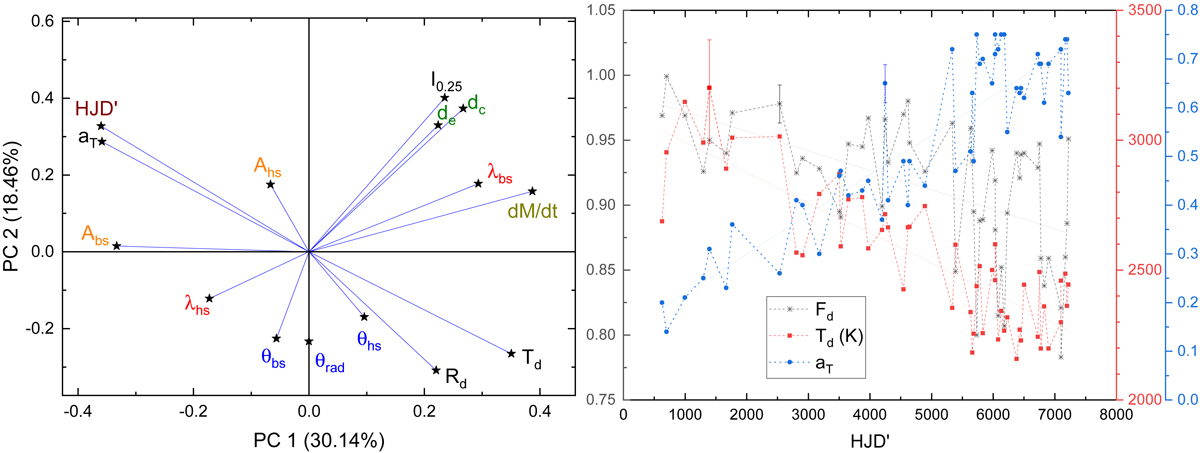
Results of the PCA analysis along with the time evolution of some disk parameters. Left panel: PCA for the parameters given in Table A.1. The two principal components, PC1 and PC2, result from lowering the dimension of the dataset. Some parameters are shown in color for a better visualization. Right panel: temporal evolution of the disk filling factor, its temperature, and temperature exponent. Best fits are also shown, with their parameters given in Table 4. Typical uncertainties are 0.03, 200 K, and 0.03 for Fd, Td and aT, respectively. They are shown for representative points to avoid data crowding.
Current usage metrics show cumulative count of Article Views (full-text article views including HTML views, PDF and ePub downloads, according to the available data) and Abstracts Views on Vision4Press platform.
Data correspond to usage on the plateform after 2015. The current usage metrics is available 48-96 hours after online publication and is updated daily on week days.
Initial download of the metrics may take a while.