Free Access
Fig. A.1.
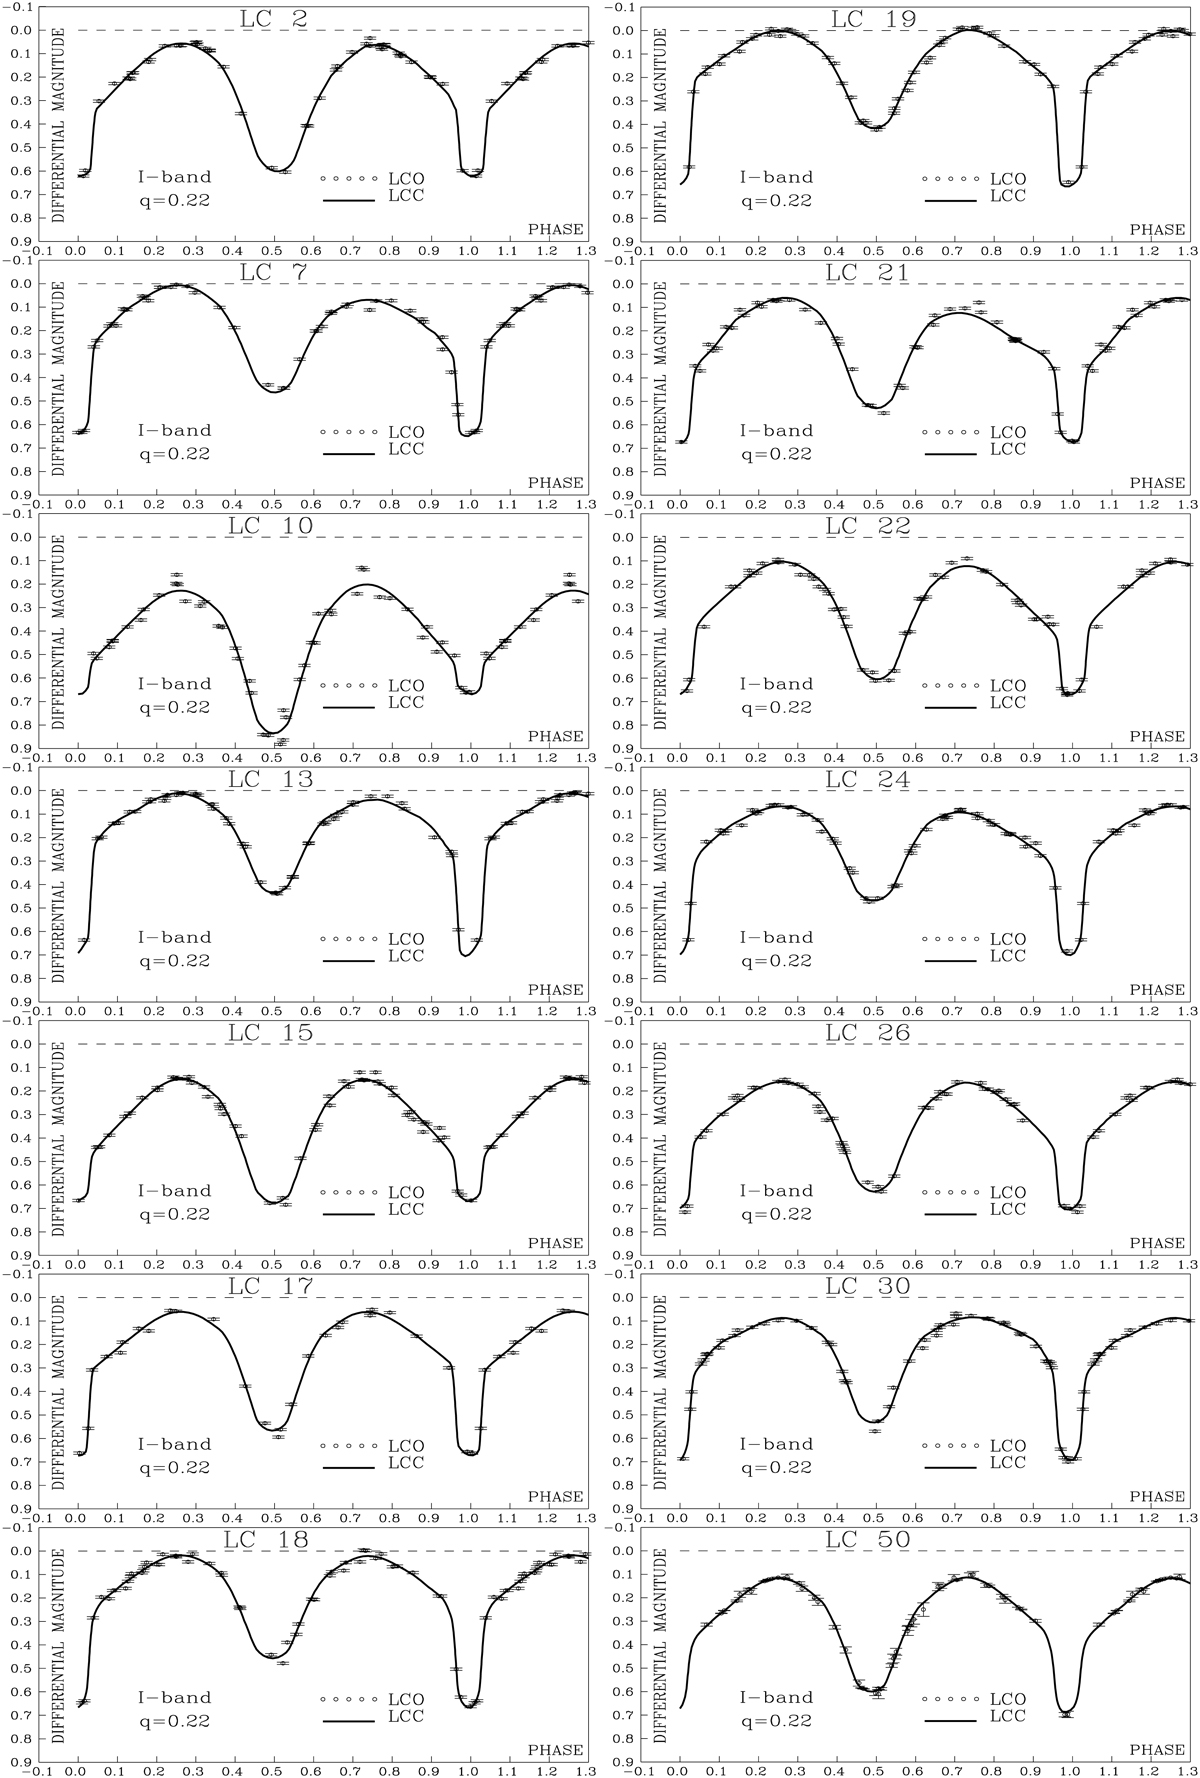
Download original image
Orbital I-band differential light curves and the respective fits for some of the data segments listed in Table A.1. The dashed line indicates the maximum brightness of the system in the orbital phase 0.25 during all the observations. All the brightness curves are normalized in relation to this maximum brightness.
Current usage metrics show cumulative count of Article Views (full-text article views including HTML views, PDF and ePub downloads, according to the available data) and Abstracts Views on Vision4Press platform.
Data correspond to usage on the plateform after 2015. The current usage metrics is available 48-96 hours after online publication and is updated daily on week days.
Initial download of the metrics may take a while.