Fig. 11.
Download original image
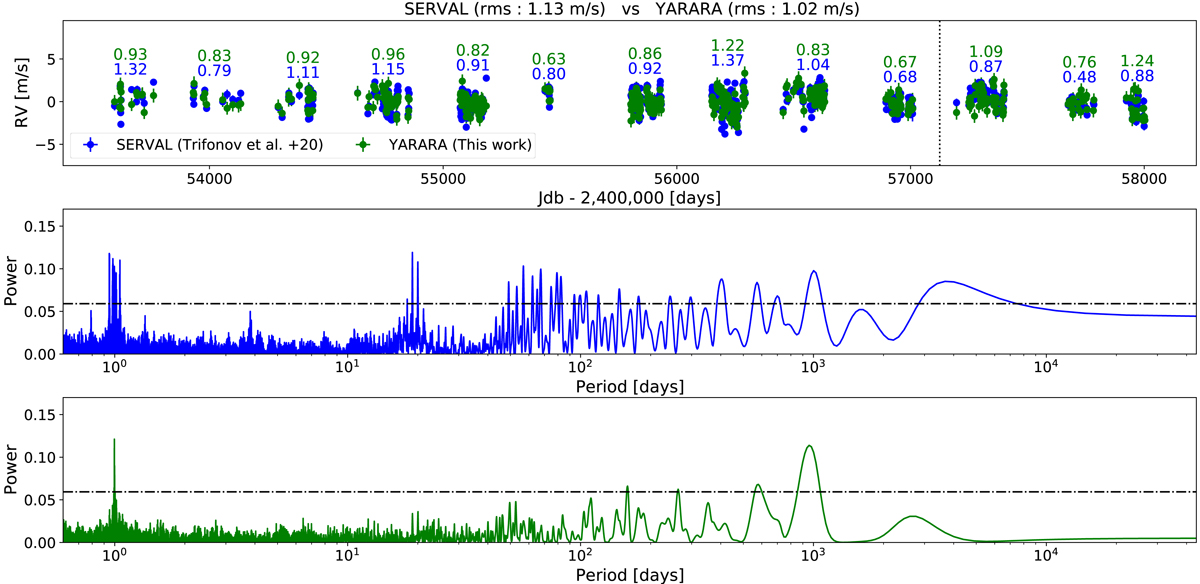
Same comparison as Fig. 10, except that the comparison is now between YARARA time series (green dots) and the SERVAL post-processing pipeline (with night-to-night offset correction, blue dots) presented in Trifonov et al. (2020). The rms is lower with YARARA for all the observational seasons before the fibre upgrade. The periodogram also presents a cleaner aspect.
Current usage metrics show cumulative count of Article Views (full-text article views including HTML views, PDF and ePub downloads, according to the available data) and Abstracts Views on Vision4Press platform.
Data correspond to usage on the plateform after 2015. The current usage metrics is available 48-96 hours after online publication and is updated daily on week days.
Initial download of the metrics may take a while.