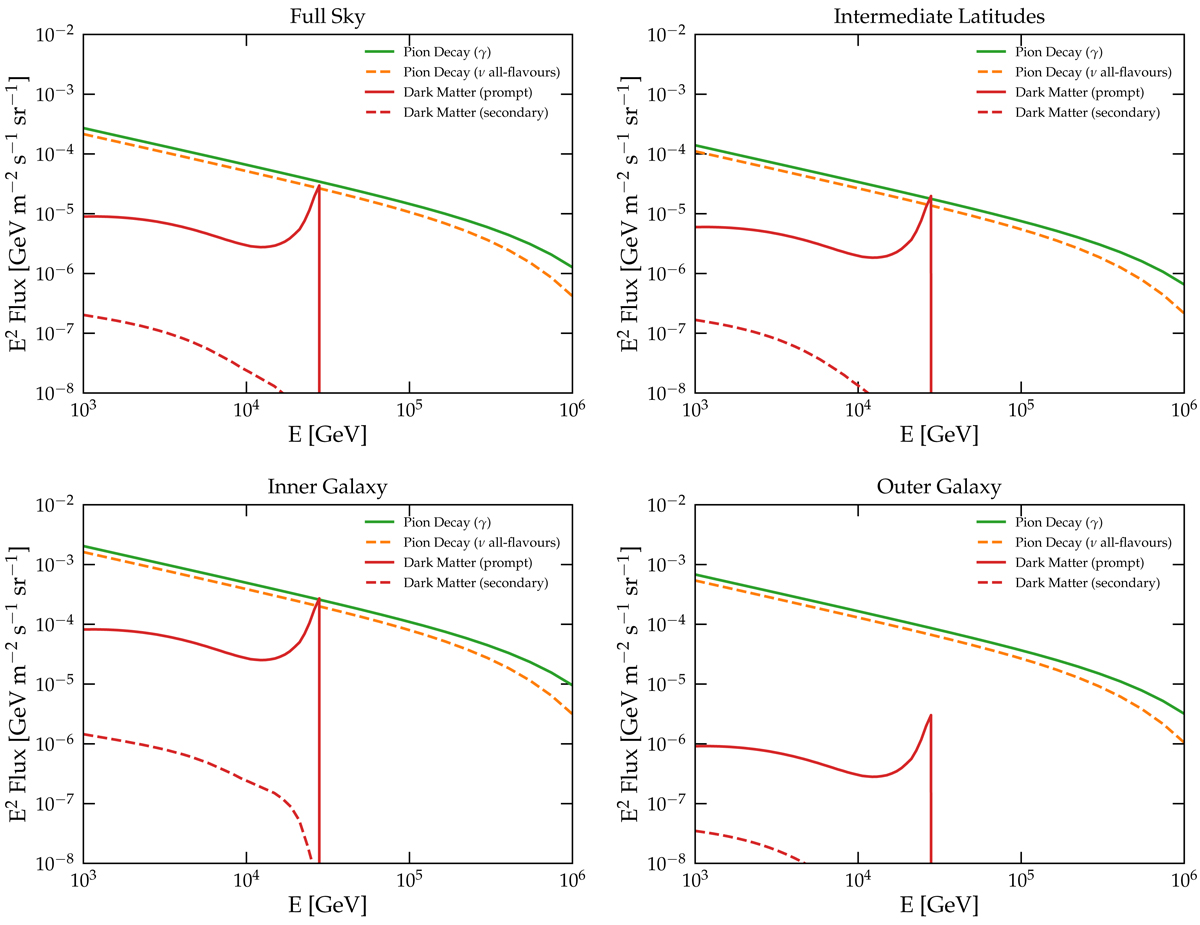
Fig. 9.
Download original image
Spectra extracted from the same four sky regions as in Fig. 6. The gamma-ray spectrum from the π0-decay (green solid line) is compared with the ν spectrum (summed over all flavors) attributable to π±-decay (orange dashed line). The prompt gamma-ray spectrum expected from DM annihilation in W+W− (with mass Mχ = 30 TeV and cross-section ⟨σv⟩ = 3 × 1027 cm2 s−1) is shown with a red solid line. The IC from DM secondary leptons is also shown with a red dashed line.
Current usage metrics show cumulative count of Article Views (full-text article views including HTML views, PDF and ePub downloads, according to the available data) and Abstracts Views on Vision4Press platform.
Data correspond to usage on the plateform after 2015. The current usage metrics is available 48-96 hours after online publication and is updated daily on week days.
Initial download of the metrics may take a while.