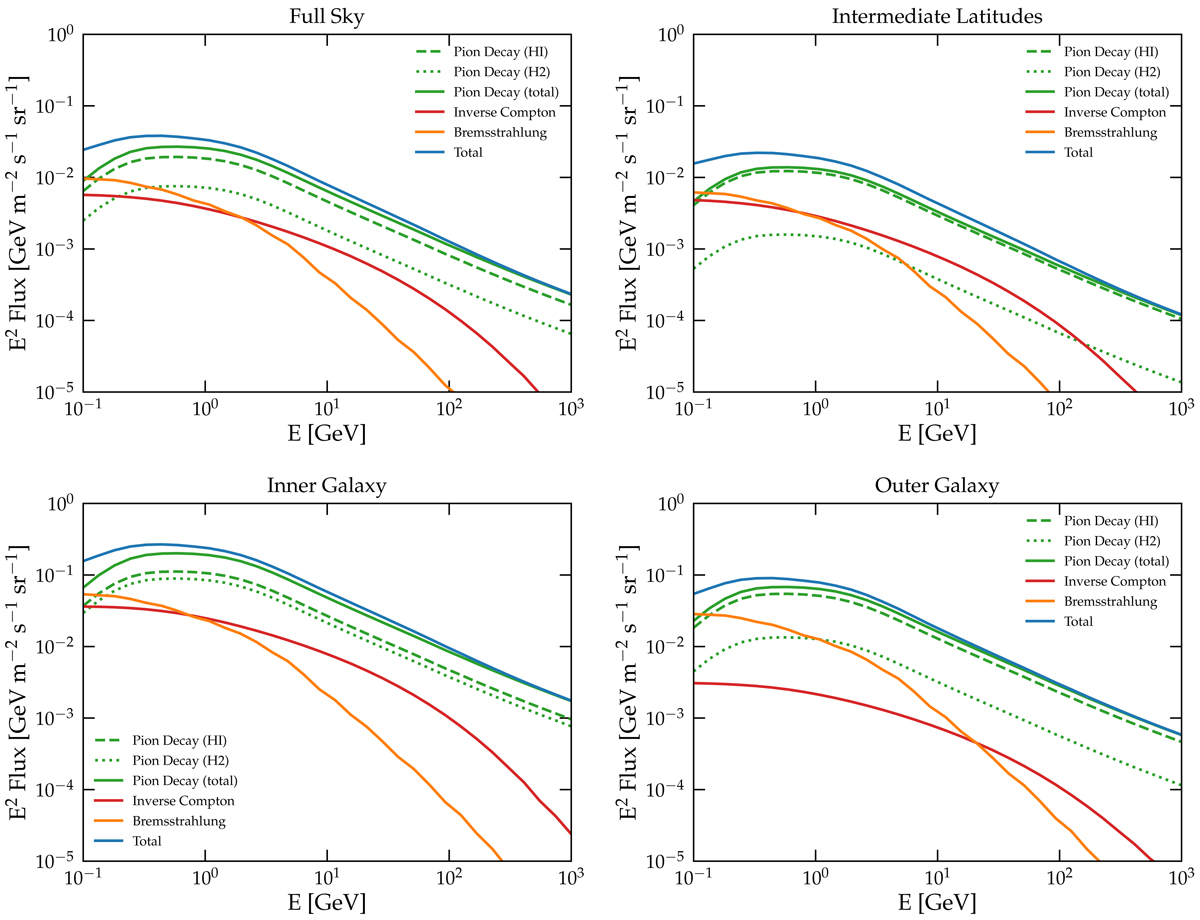
Fig. 6.
Download original image
Gamma-ray spectra extracted from four sky regions: full-sky (top-left), intermediate latitudes (10° < |b| < 40°, top-right), inner Galaxy (|b| < 8° ∧80° < l < 280°, bottom-left), and outer Galaxy (|b| < 8° ∧l < 80° ∧l > 280°, bottom-right). The total gamma-ray spectrum (blue solid line) is computed as the sum of three basic emission components: inverse Compton (red solid line), bremsstrahlung (orange solid line), and π0-decay (green solid line). For the pion decay we show the contributions of HI (green dashed line) and of H2 (green dotted line) separately.
Current usage metrics show cumulative count of Article Views (full-text article views including HTML views, PDF and ePub downloads, according to the available data) and Abstracts Views on Vision4Press platform.
Data correspond to usage on the plateform after 2015. The current usage metrics is available 48-96 hours after online publication and is updated daily on week days.
Initial download of the metrics may take a while.