Free Access
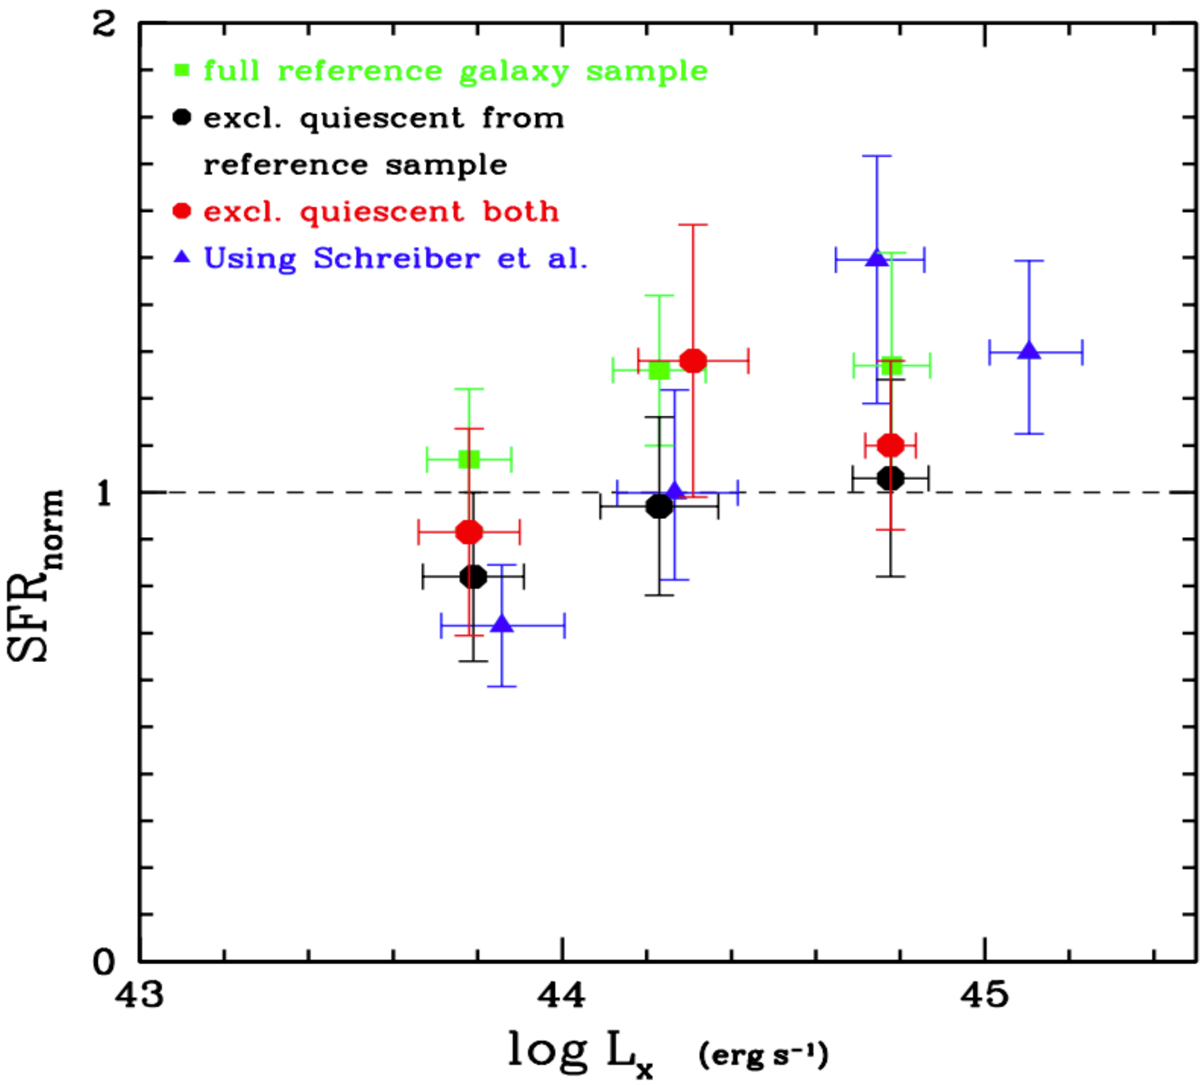
Fig. 8.
Download original image
SFRnorm vs. X-ray luminosity. SFRnorm and LX are the mean values of the measurements presented in Figs. 7 and 9, grouped in LX bins of 0.5 dex, at all redshfits combined, and weighted based on the number of sources in each bin shown in Fig. 7. The errors represent the standard deviation of SFRnorm and LX in each bin.
Current usage metrics show cumulative count of Article Views (full-text article views including HTML views, PDF and ePub downloads, according to the available data) and Abstracts Views on Vision4Press platform.
Data correspond to usage on the plateform after 2015. The current usage metrics is available 48-96 hours after online publication and is updated daily on week days.
Initial download of the metrics may take a while.