Fig. 11.
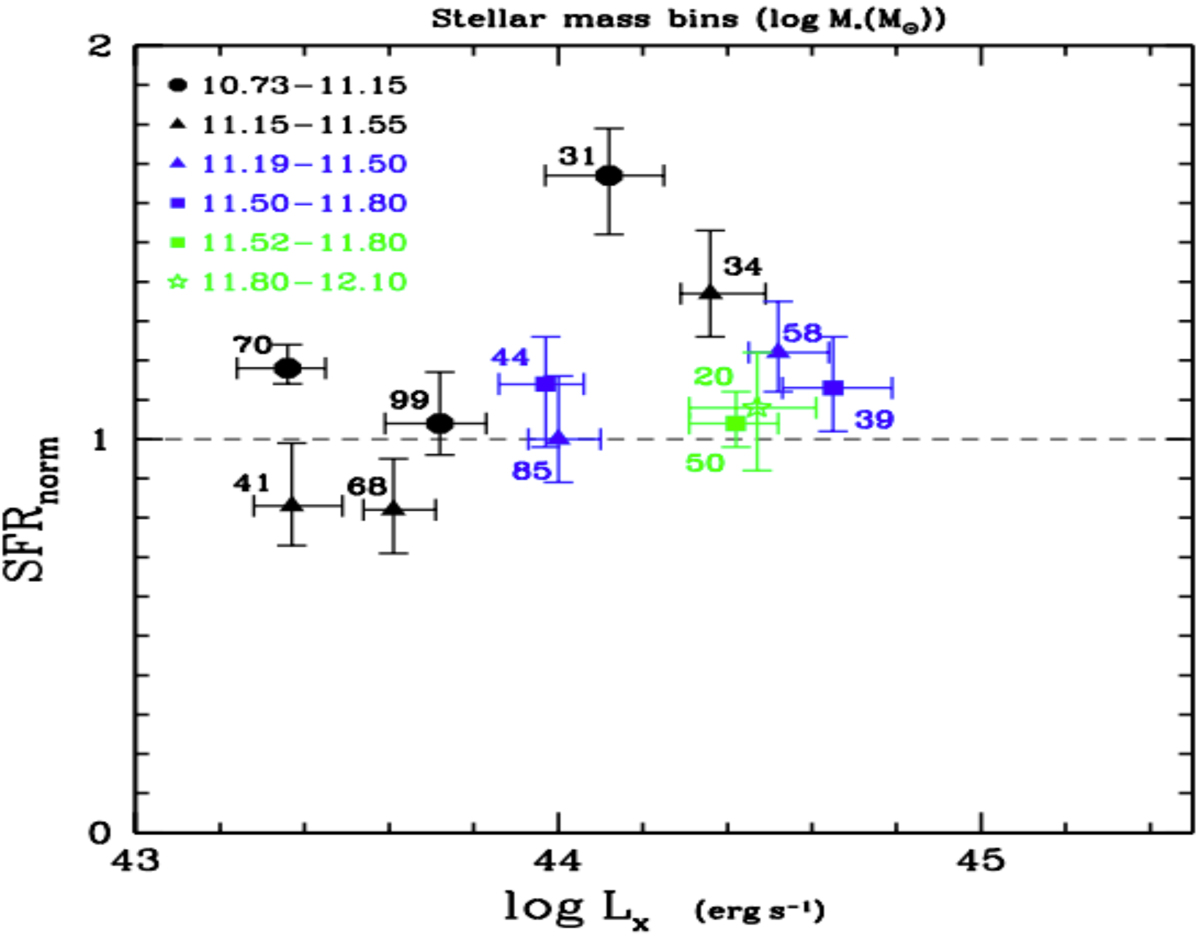
Download original image
SFRnorm vs. X-ray luminosity. The SFRnorm was estimated after excluding quiescent systems from both the X-ray and the reference galaxy catalogues (see text for more details). The results are grouped in LX bins of 0.5 dex width and stellar mass bins. The results are colour-coded based on the redshift range (black for 0.5 < z < 1.0, blue for 1.0 < z < 1.5, and green for 1.5 < z < 2.0). Different symbols refer to different stellar mass intervals, as indicated in the legend. M* values are in log [M*(M⊙)]. Median SFRnorm values are presented and the errors are calculated using bootstrap resampling. The number of sources included in each bin are shown next to each symbol.
Current usage metrics show cumulative count of Article Views (full-text article views including HTML views, PDF and ePub downloads, according to the available data) and Abstracts Views on Vision4Press platform.
Data correspond to usage on the plateform after 2015. The current usage metrics is available 48-96 hours after online publication and is updated daily on week days.
Initial download of the metrics may take a while.