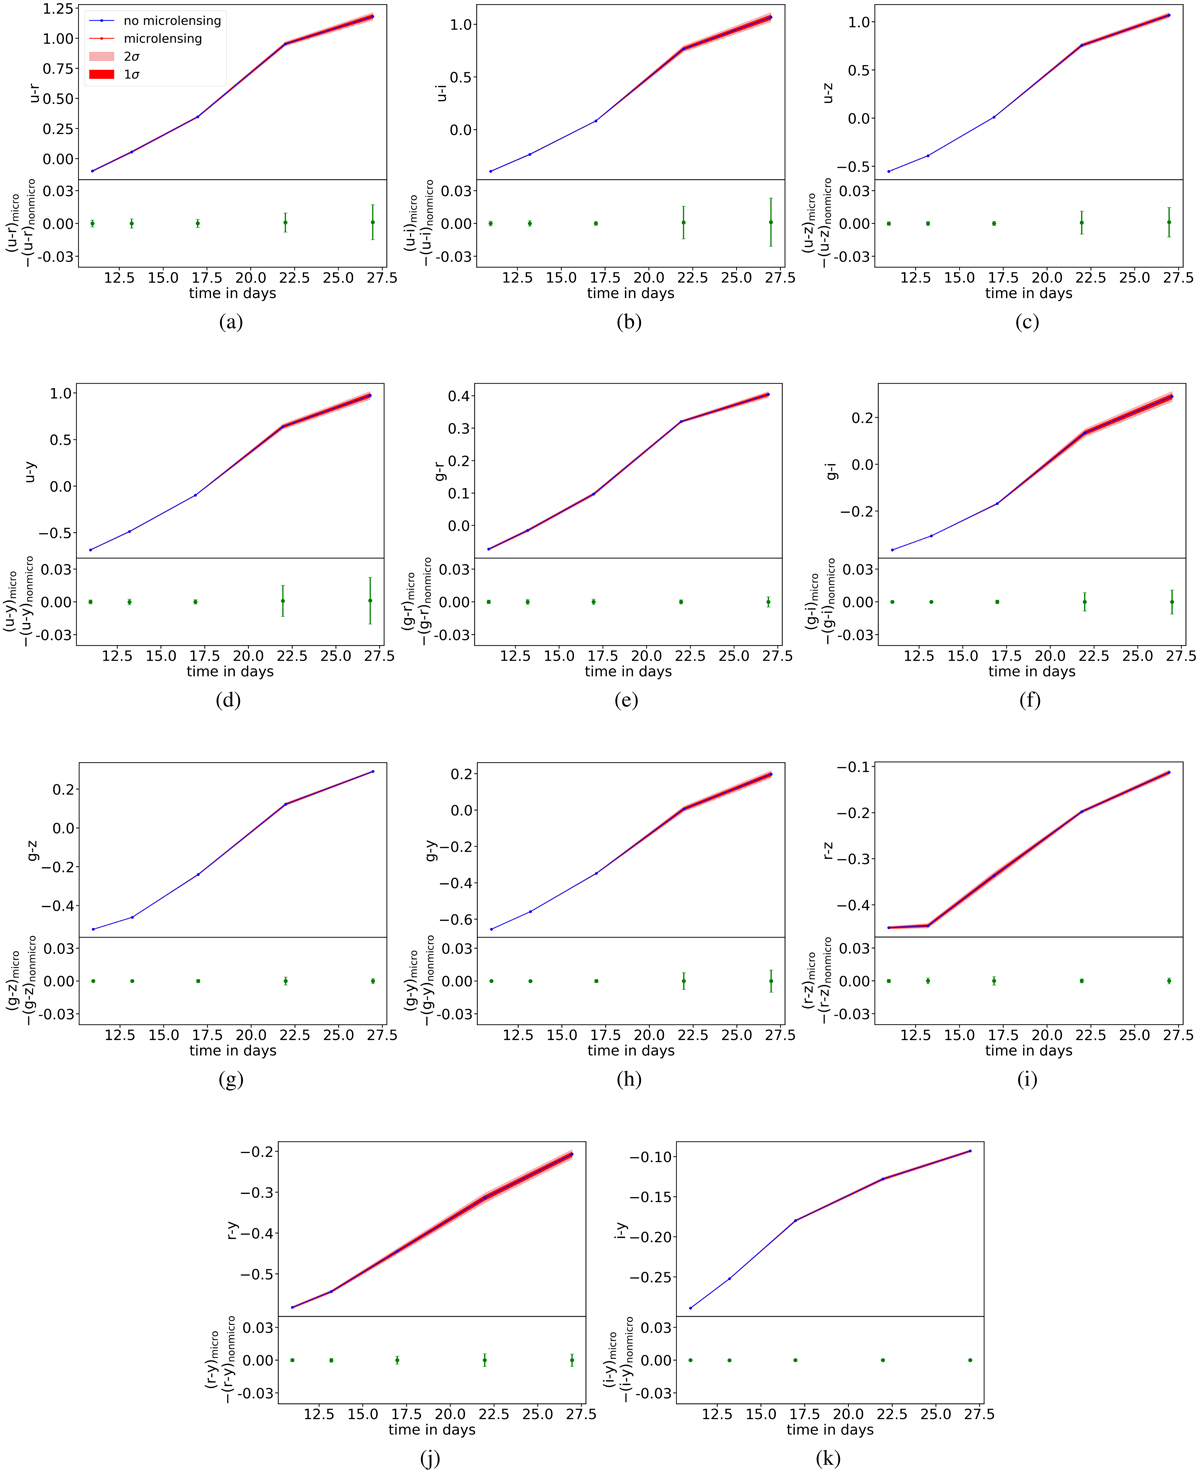
Fig. A.1.
Download original image
Color curves of the non-microlensed and microlensed spectra with median, 1σ, and 2σ ranges obtained from 10 000 random positions in the type I lensing magnification map with κ = 0.36 and γ = 0.35. In addition, the bottom part of each panel (Figs. A.1a–k) shows the deviation of the microlensed color from the non-microlensed color with 1σ uncertainties.
Current usage metrics show cumulative count of Article Views (full-text article views including HTML views, PDF and ePub downloads, according to the available data) and Abstracts Views on Vision4Press platform.
Data correspond to usage on the plateform after 2015. The current usage metrics is available 48-96 hours after online publication and is updated daily on week days.
Initial download of the metrics may take a while.