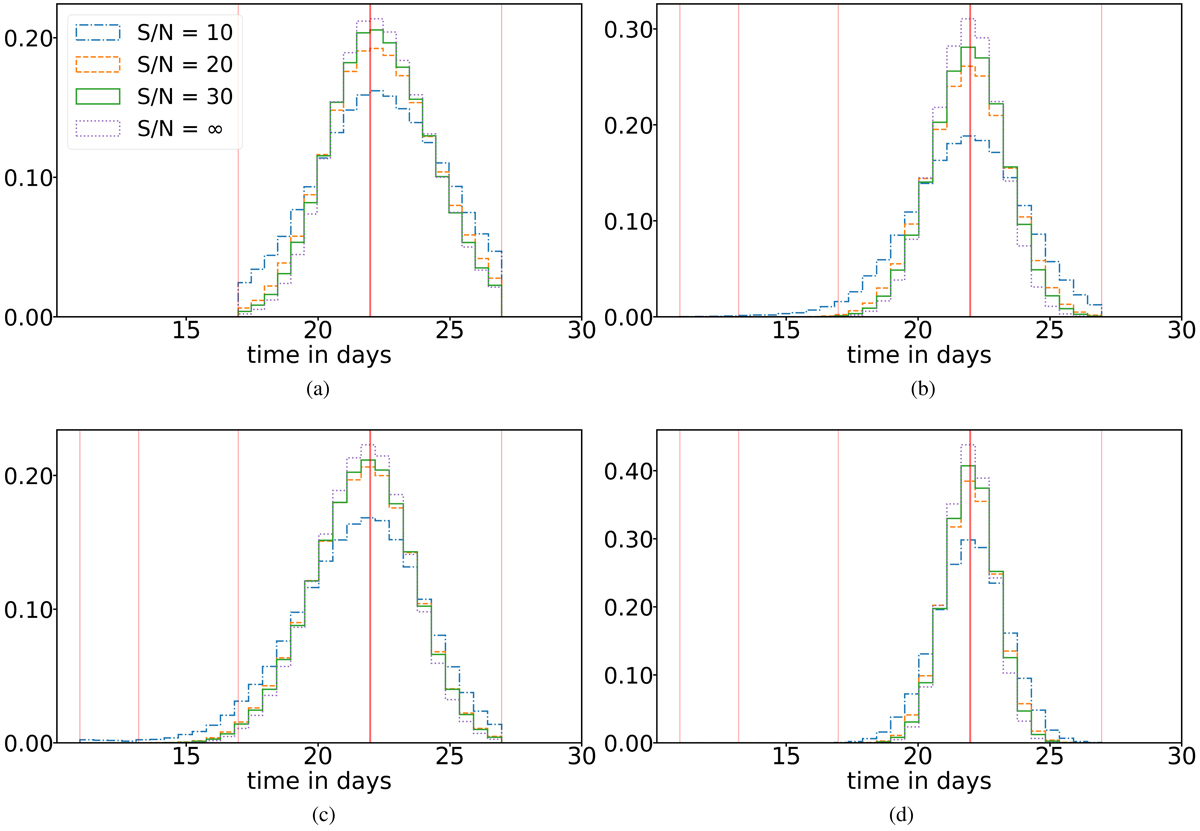
Fig. 12.
Download original image
Histograms of the retrieved phases of the second SN image using the absorption lines Fe II, Hα, and Hβ. The phase inference is done for S/N = 10, 20, and 30 and for noiseless spectra. The red vertical lines in the histograms indicate the epochs of the five available spectra of the first SN image. The thick vertical line marks the input value. By using the wavelengths of absorption features, the phase of the second SN image is correctly recovered. (a) Retrieved phase using the absorption line of Fe II. (b) Retrieved phase using the absorption line of Hα. (c) Retrieved phase using the absorption line of Hβ. (d) Retrieved phase combining all three absorption lines.
Current usage metrics show cumulative count of Article Views (full-text article views including HTML views, PDF and ePub downloads, according to the available data) and Abstracts Views on Vision4Press platform.
Data correspond to usage on the plateform after 2015. The current usage metrics is available 48-96 hours after online publication and is updated daily on week days.
Initial download of the metrics may take a while.